
Commanders WR Battle 2026: Williams, Burks Chase WR2
Commanders WR battle 2026: rookie Antonio Williams and value bet Treylon Burks chase the WR2 job opposite Terry McLaurin in Jayden Daniels’ offense.


For our 77-part “Does It Matter?” series, we explored whether a Wide Receiver’s Burst Score — sourced from PlayerProfiler — can serve as a reliable predictor for future success in the NFL. Within this article, we uncover the correlation, importance, and ideal benchmarks within this metric. Here are all of our findings:
Our research methodology focused on analyzing the top 50 fantasy football finishers from 2003 onward, using PPR (Points Per Reception) fantasy scores. In this analysis, you will see the term “bottom 10”, which we defined as the finishers ranked 41st to 50th each season.
Why only the top 50? We aimed to maintain a balanced approach. Going beyond this threshold would include fringe roster players who wouldn’t make the top 10 and could therefore only distort the data. Conversely, we wanted to contrast the best and worst performers, which means including players significantly different from the top 10. Therefore, we looked at those ranked 41st-50th to compare with the top 10.
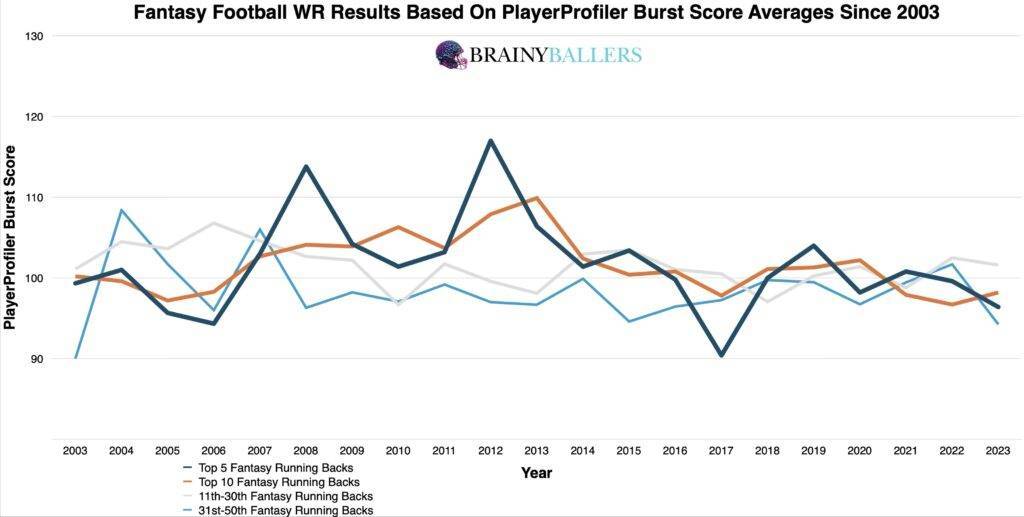
To begin, We created an averages chart that categorized data into four segments: top 5, top 10, 11th-30th, and 31st-50th place since 2003. The hopes was for this to reveal obvious visual trends that correlated Burst Score with fantasy success. From this, a slight pattern emerged: players with higher Burst Scores typically recorded higher fantasy points. Specifically, in 14 out of 21 seasons (approximately 66.7%), the top 5 fantasy finishers had higher Burst Scores than those in the 31st-50th bracket. This reinforced the possible theory that higher Burst Scores are often associated with greater fantasy performances.
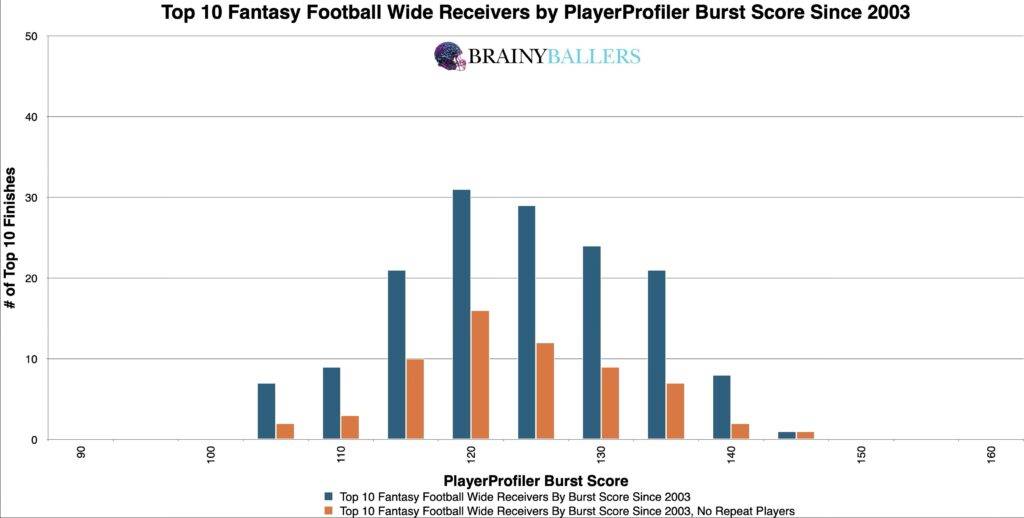
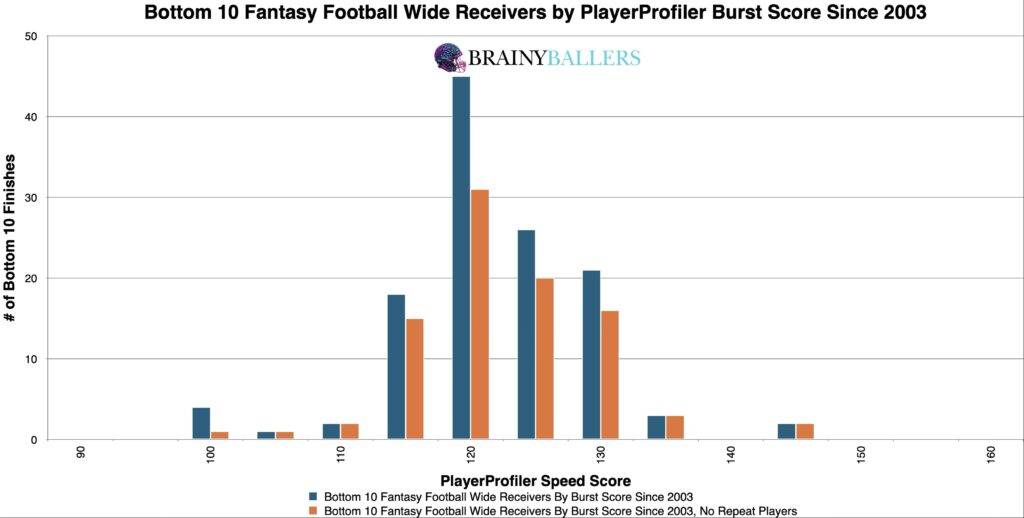
To dive deeper in this analysis, we charted the top 10 fantasy finishers since 2003 by segmenting their Burst Scores into 0.1 increments. This segmentation compares the weight and distribution of Burst Scores among the successful and less successful players. From this, you cannot tell a clear and obvious correlation between higher Burst Scores and higher fantasy outcomes. You can compare the weight and distribution of both these charts below, with the top 10 coming first:
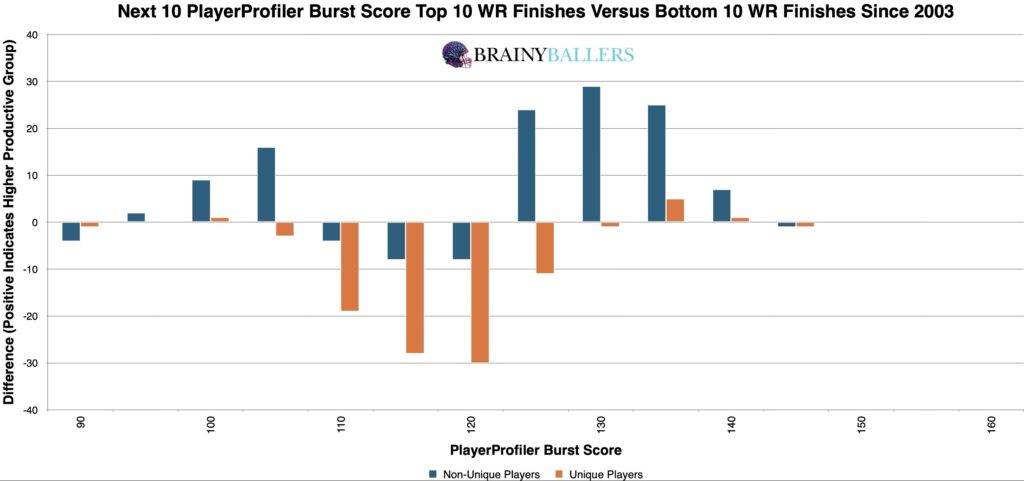
In our main goal to determine a threshold that reliably signals top-level consistency while minimizing the influence of unique players, we looked to our differences chart. this compares each burst score and the subsequent 10.0 burst score, subtracting the bottom 10 results from the top 10 within that group. The chart’s desired outcome is a negative number for unique differences (Orange) and a positive number for non-unique differences (Blue). This would indicate the top level consistency we are hoping for. From this analysis, it emerged that a score of 125 and above marked a potential range for top performances, which we will attempt to verify next.
We conducted thorough number crunching to make adjustments in our potential optimal range. After experimenting with different values around the initially identified range, we discovered that altering the range to scores of 133 and above resulted in a 15.8% increased appearance rate among the top 10 performers compared to the bottom 10. This refined range will therefore be the optimal range for WR Burst Scores and will be included in our Ultimate Athlete Blueprints, which offers an easy-to-read table housing all of our researched metrics combined in one place for you to view as seen here:

Due to these findings, burst score could play a factor in our Star-Predictor Score (SPS) model. The Star-Predictor Score (SPS) is a scouting tool designed to maximize investment potential and reduce risks when drafting rookies in Fantasy Football. It is proven to have a higher accuracy than draft capital alone to predict fantasy football success. The SPS includes 13 to 17 metrics, with the exact number varying by the player’s position. All these metrics are pre-NFL – some of which are proprietary to BrainyBallers – providing a complete analysis of a player’s analytical profile. The SPS gained widespread notoriety for its high accuracy, having made it on Barstool and The Pat McAfee Show. The SPS can be found here, and future projected SPS grades can be unlocked here.

Don’t just draft for this year. Gain the knowledge needed to position yourself to secure your future with SPS rookie data.
Using standard statistical methods with the Pearson Value provided further insights into the significance of WR Burst Scores on fantasy points:
This value indicates no strong correlation between a WR’s burst score and future fantasy production when applying standard statistical methods. We are hoping for a minimum of 0.1, or an inverse correlation maximum of -0.1 when we study world-class athletes as we are. For reference to something that everyone acknowledges matters in prospect scouting, and to show the accompanying Pearson value, QB draft capital prevailed a -0.219 Pearson value.
Next, we extended our analysis to study the top 50 across the last two decades to see if this is a growing or dying trend. That chart can be seen below, where you can see a slightly declining trend from its already questionable significance telling by comparing the bottom 10 to the top 10 in both decades.
| 2004-2013 | |||
| Top 10 | 11 through 40 | Bottom 10 | |
| All count | 60 | 164 | 37 |
| All 133 and above | 14 | 22 | 2 |
| % (Optimal Range/all) | 23.3% | 13.4% | 5.4% |
| 2014-2023 | |||
| Top 10 | 11 through 40 | Bottom 10 | |
| All count | 88 | 254 | 84 |
| All 133 and above | 15 | 21 | 3 |
| % (Optimal Range/all) | 17.0% | 8.3% | 3.6% |
While Burst Scores offer a slight glimpse into a Wide Receiver’s potential success, they are a very small piece of a larger puzzle. This metric should not be used alone when scouting future Wide Receiver prospects. Our research found that if this were still desired to be used, 133 Burst Score and above is what should be looked for in athletes.
Our series has always sought to push the boundaries of sports analytics. This latest installment reaffirms our commitment to uncovering the hidden dynamics that define the game. Every Saturday, we’ll dive into intriguing questions, bust myths, and settle debates with thorough analysis. We welcome your input. Therefore, please leave comments or reach out with topics you’re eager to see dissected. All of our research can be found on our Analytics Page. Up next on our agenda for Part 78 of “Does It Matter?” is an examination of Wide Receiver PlayerProfiler Speed Scores: Does it matter? If so, what’s the speed score threshold necessary for NFL success? Mark your calendars; every Saturday we shed light on the topics that matter to you. All it takes is a quick question being asked and we will go to work for you!


BrainyBallers Buy-Hold-Sell Chart (All Players)
Commanders WR battle 2026: rookie Antonio Williams and value bet Treylon Burks chase the WR2 job opposite Terry McLaurin in Jayden Daniels’ offense.

The 2026 Cowboys WR depth chart, role by role: CeeDee Lamb anchors, George Pickens ascends, Ryan Flournoy sleeps, and everyone else gets squeezed.

Saints WR depth chart 2026: rookie Jordyn Tyson is carving a No. 2 role behind Chris Olave at OTAs, with Juwan Johnson anchoring the passing game.