
Commanders WR Battle 2026: Williams, Burks Chase WR2
Commanders WR battle 2026: rookie Antonio Williams and value bet Treylon Burks chase the WR2 job opposite Terry McLaurin in Jayden Daniels’ offense.


For Part 91 of our “Does It Matter?” series we looked to figure out if a Tight End’s Catch Radius can help predict their future success, how much weight you should put on it, and what the ideal benchmark is for this metric. We found a specific Catch Radius range that occurred at a significantly higher rate in the top 10 compared to the bottom 10. Below, we break down the correlation to help you decide between two players and evaluate a rookie prospects.
To maintain consistency with our previous studies, we examined the top 50 fantasy football finishers at the position dating back to 2005 – which is when Catch Radius tracking began from our data source PlayerProfiler. We utilized PPR scoring for all fantasy points. Throughout this article, you will see references to the “Bottom 10.” In the context of this study, this refers to players finishing 41st through 50th in any given season.
Why the top 50? We capped our data set at the top 50 to find a “happy medium.” Expanding the scope beyond the top 50 would introduce fringe roster players whose lack of volume and playing time would only skew the data. However, to understand what makes a player elite, we need a strong point of comparison. We wanted to weigh the “best” against the “worst” relative to the sample size. By isolating the 41st-50th place finishers, we established a baseline of replacement-level production. This allows us to compare them directly to the top 10 and identify the specific physical traits that separate the league-winners from the roster-cloggers.
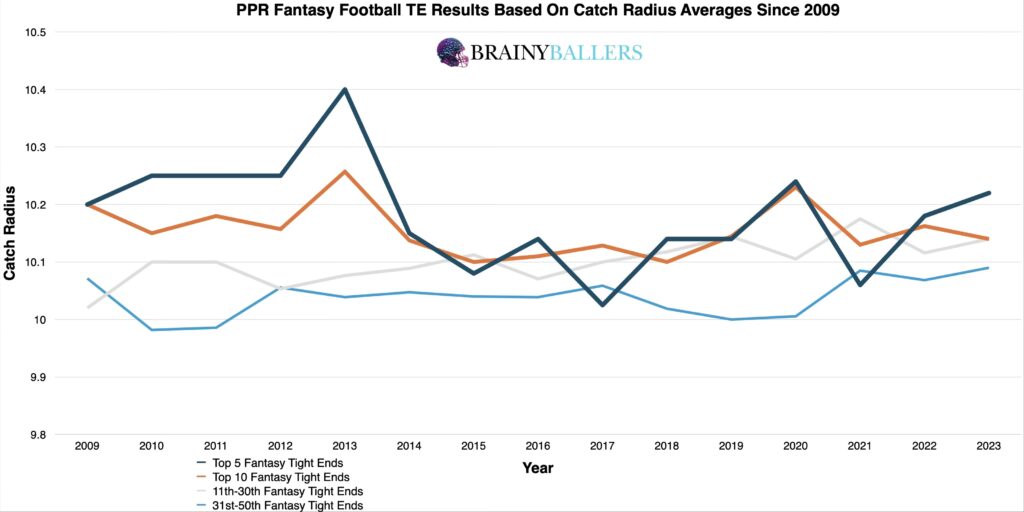
We began by creating an averages chart which segments the field into four specific tiers: the top 5, top 10, 11-30th, and the 31st-50th place finishers each season. A clear trend emerged immediately: Higher Catch Radiuses correlated with higher fantasy scores.
Specifically, in 13 of the 15 seasons analyzed (86.6%), the Top 5 finishers boasted a larger Catch Radius than the 31st-50th place finishers. This suggests that having the physical wingspan to bail out a quarterback could be a defining trait of the highest-scoring fantasy assets.
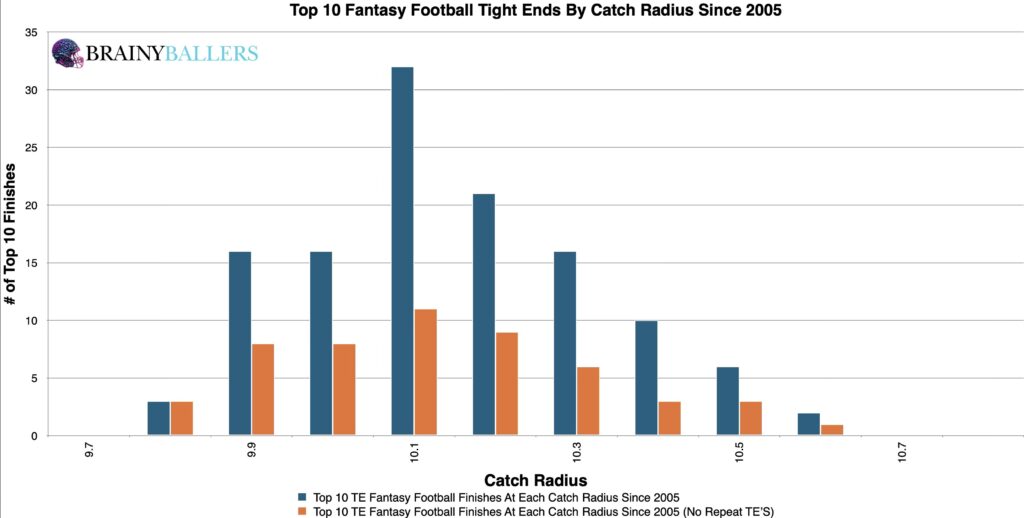
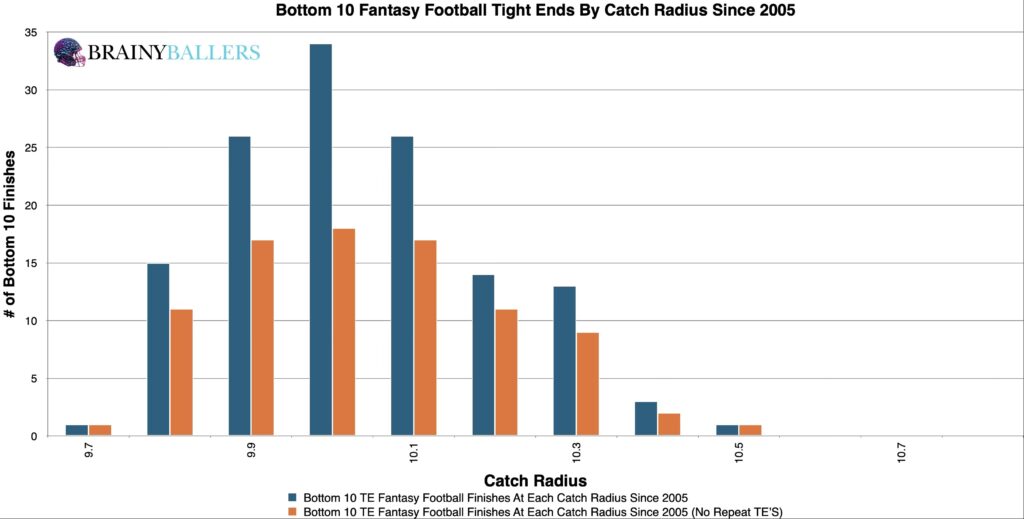
To dig deeper, we charted the top 10 finishers since 2005 and segmented them into buckets rounded to the nearest 0.1 Catch Radius.
When visualizing the weight and distribution of these charts, the correlation strengthened. The density of top-tier fantasy producers shifted toward the higher end of the Catch Radius spectrum. While players with smaller catch radiuses can finish in the top 10, the probability once again appears to drop when compared to their counterparts. You can see both of those charts next, with the top 10 coming first:
Our goal was to also identify an optimal range which historically signals top-level consistency. To do this, we constructed a Differences Chart. We compared each Catch Radius bucket (plus the subsequent 0.2 range) and subtracted the frequency of Bottom 10 results from the Top 10 results within that group. The chart’s desired outcome is a negative number for unique differences (Orange) and a positive number for non-unique differences (Blue). From this analysis, a distinct threshold emerged: 10.1 and above appears to be a possible optimal range for top-performing talent, moving us closer to a definitive benchmark.
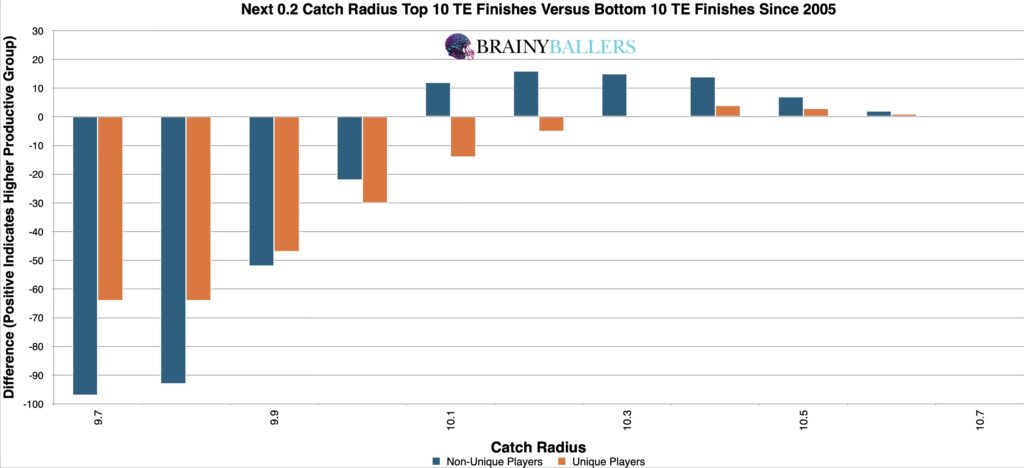
We performed additional range adjustments in our spreadsheet to stress-test this finding and ensure we identified the highest-producing optimal range. After testing various numbers surrounding the initial findings from our differences chart, the data held firm. We found that maintaining the threshold at 10.1 and above yields a 28.5% higher Top 10 appearance rate compared to the Bottom 10. Therefore, 10.1 and above is the optimal range you should hope for in Tight End prospects and will also be included in our Ultimate Athlete Blueprints which offers an easy-to-read table housing all of our researched metrics combined in one place for you to view as seen here:

To confirm these findings weren’t just variance, we applied standard statistical tests to the dataset with the Pearson correlation coefficient.
In the context of this study, this value indicates a strong correlation between larger Catch Radiuses and future fantasy production. We are hoping for a minimum of 0.1, or an inverse correlation maximum of -0.1 when studying world-class athletes as we are. For reference to something that everyone acknowledges matters in prospect scouting, and to show the accompanying Pearson value, QB draft capital prevailed a -0.219 Pearson value.
Due to these findings, Catch Radiuses could play a factor in our Star-Predictor Score (SPS) model. The Star-Predictor Score (SPS) is a scouting tool designed to maximize investment potential and reduce risks when drafting rookies in Fantasy Football. It is proven to have a higher accuracy than draft capital alone to predict fantasy football success. The SPS includes 13 to 17 metrics, with the exact number varying by the player’s position. All these metrics are pre-NFL – some of which are proprietary to BrainyBallers – providing a complete analysis of a player’s analytical profile. The SPS gained widespread notoriety for its high accuracy, having made it on Barstool and The Pat McAfee Show. The SPS can be found here, and future projected SPS grades can be unlocked here.

Don’t just draft for this year. Gain the knowledge needed to position yourself to secure your future with SPS rookie data.
So, does it matter? Yes, it does. When standard statistical analysis is applied, there is a clear advantage for Tight Ends possessing a larger Catch Radius. If you are stuck deciding between two Tight Ends, the player with the larger Catch Radius is the statistically safer bet. This metric should serve as a tiebreaker in your prospect rankings and a key filter when scouting for the next breakout star.
Our series has always sought to push the boundaries of sports analytics. This latest installment reaffirms our commitment to uncovering the hidden dynamics that define the game. Every Saturday, we’ll dive into intriguing questions, bust myths, and settle debates with thorough analysis. We welcome your input. Therefore, please leave comments or reach out with topics you’re eager to see dissected. All of our research can be found on our Analytics Page. Up next on our agenda for Part 91 of “Does It Matter?” is an examination of Tight End Agility Scores: Do They Matter? If so, what’s the Agility Score threshold necessary for NFL success? Mark your calendars; every Saturday we shed light on the topics that matter to you. All it takes is a quick question being asked and we will go to work for you!


BrainyBallers Buy-Hold-Sell Chart (All Players)
Commanders WR battle 2026: rookie Antonio Williams and value bet Treylon Burks chase the WR2 job opposite Terry McLaurin in Jayden Daniels’ offense.

The 2026 Cowboys WR depth chart, role by role: CeeDee Lamb anchors, George Pickens ascends, Ryan Flournoy sleeps, and everyone else gets squeezed.

Saints WR depth chart 2026: rookie Jordyn Tyson is carving a No. 2 role behind Chris Olave at OTAs, with Juwan Johnson anchoring the passing game.