
Commanders WR Battle 2026: Williams, Burks Chase WR2
Commanders WR battle 2026: rookie Antonio Williams and value bet Treylon Burks chase the WR2 job opposite Terry McLaurin in Jayden Daniels’ offense.


In evaluating the potential future success of tight ends in the NFL, the 69-part “Does It Matter?” series has been investigating various metrics to find which stats matter and which ones are just noise. One stat examined is the predictive value of a tight end’s college yards after catch per reception (YAC/Rec) on their professional performance. Here are all of our findings:
For the structure of our analysis, we focused on the top 50 fantasy football performers in PPR (points per reception) formats since 2017. Within this group, the term “bottom 10” refers to players ranked 41st to 50th in fantasy finishes each season. All YAC/Rec data is from PFF, and is the players’ career YAC/Rec, not their top or senior season.
Why select the top 50? We aimed for a “happy medium.” Expanding further would include fringe roster players who are unlikely to rank in the top 10 and therefore potentially could only skew the data. Alternatively, to effectively compare from best to worst, we needed a group contrasting significantly with the top 10. Therefore, we focused on finishers ranked 41st to 50th to compare back to the top 10.
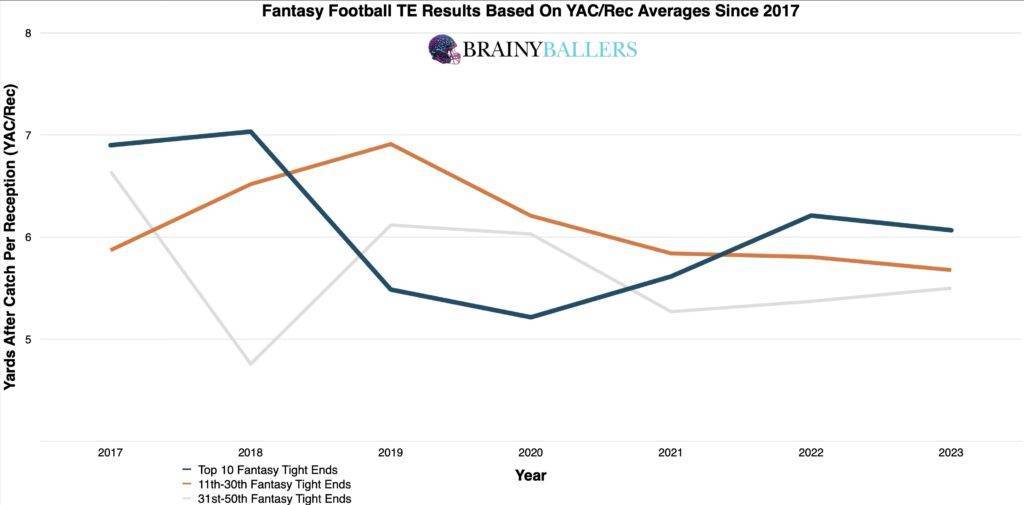
To kick-start our study, we looked to our averages chart to spot any obvious visual trends. This draws data from the top 5, top 10, 11th-30th, and 31st-50th place finishers since 2017. Although higher YAC/Rec scores were more prevalent in the top 10 finishers, the trend wasn’t overwhelming. Only in 5 out of the 7 seasons (a success rate of 71.4%) did the top 10 finishers outperform the bottom 10 in terms of college career YAC/Rec.
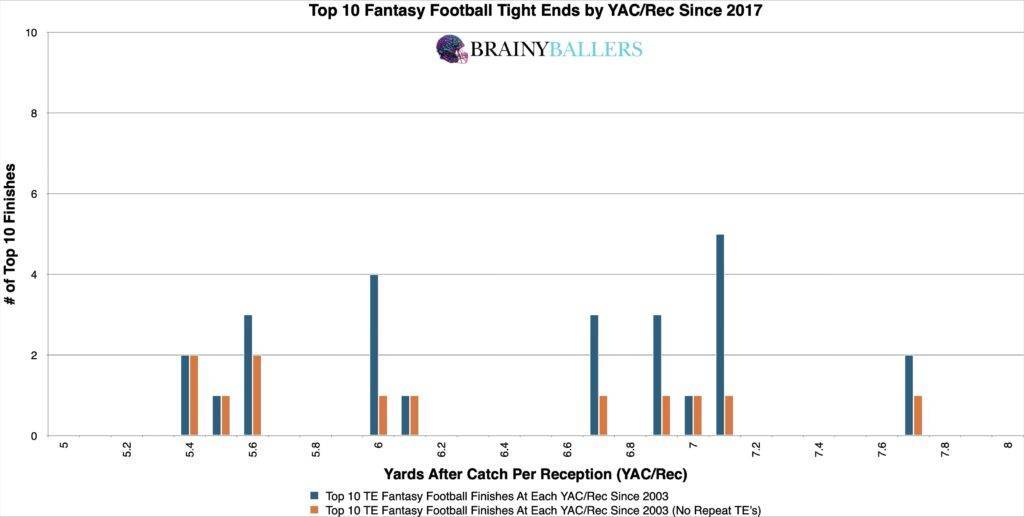
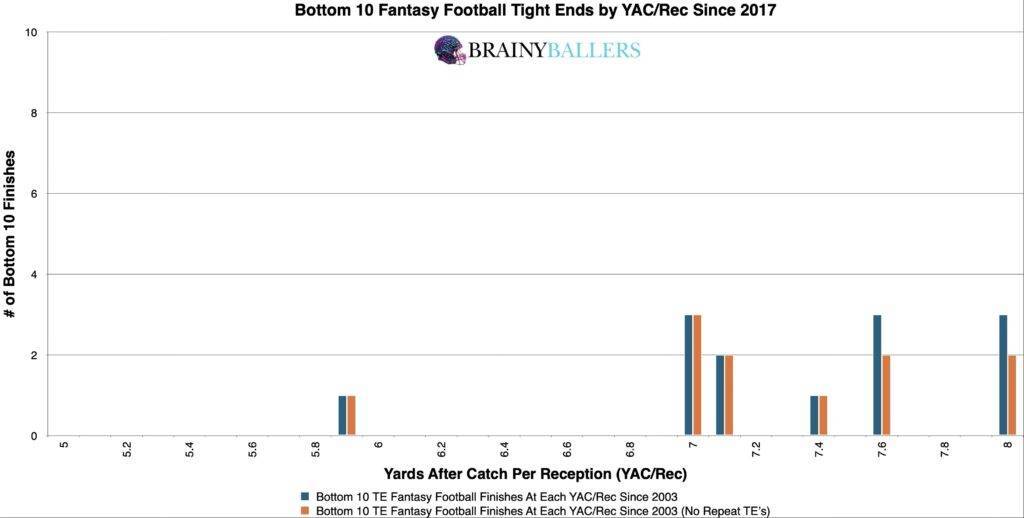
Next, we segmented the top and bottom 10 finishers since 2017 into 0.1 YAC/Rec increments. This detailed breakdown offered a granular visualization between YAC/Rec scores and fantasy successes. When comparing the weight and distribution across these two charts, it became even more concerning that we would find any trend throughout this study. If anything, it appears from this as though lower YAC/Rec’s are more prevalent in the top 10 versus the bottom 10.
In our main search of establishing a reliable YAC/Rec threshold that signals consistent top-level performance for tight ends, we utilized our differences chart. This chart compares each YAC/Rec, plus the next 0.3 YAC/Rec, while subtracting the bottom 10 from the top 10 within that group. The chart’s desired outcome is a negative number for unique differences (Orange) and a positive number for non-unique differences (Blue). This would indicate the top level consistency we are hoping for. Through this analysis, we observed that a YAC/Rec of 7.4 and below seemed to indicate a high-performing range. We will next attempt to verify this as the top producing range.
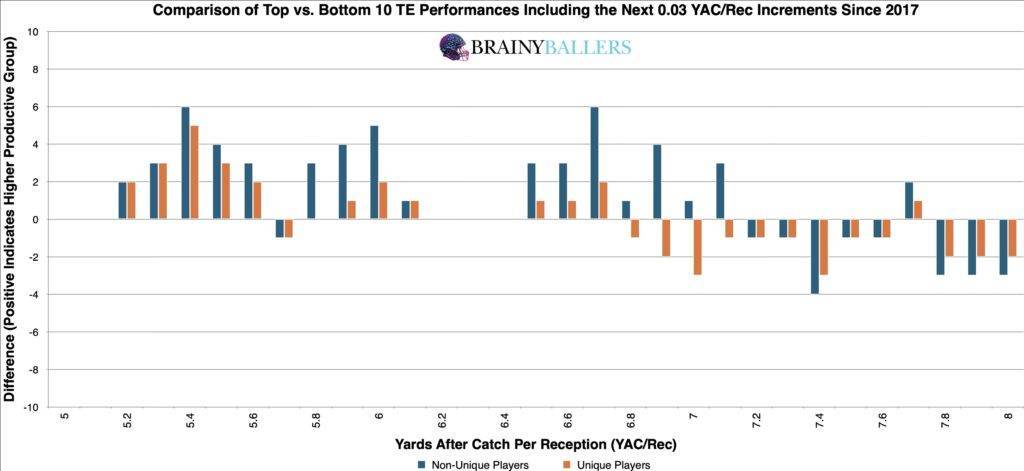
We further fine-tuned this range by adjusting numbers in our spreadsheet to identify the most productive YAC/Rec. After testing various values near the observed range from our differences chart, we discovered that adjusting the range to 4.9 to 7.3 YAC/Rec resulted in a 39.2% higher appearance rate in the top 10 compared to the bottom 10. Therefore, this range is the optimal range you should hope for when evaluating Tight Ends and will be included in our Ultimate Athlete Blueprints, which offers an easy-to-read table housing all of our researched metrics combined in one place for you to view as seen here:

Due to these findings, YAC/Rec could play a factor in our Star-Predictor Score (SPS) model. The Star-Predictor Score (SPS) is a scouting tool designed to maximize investment potential and reduce risks when drafting rookies in Fantasy Football. It is proven to have a higher accuracy than draft capital alone to predict fantasy football success. The SPS includes 13 to 17 metrics, with the exact number varying by the player’s position. All these metrics are pre-NFL – some of which are proprietary to BrainyBallers – providing a complete analysis of a player’s analytical profile. The SPS gained widespread notoriety for its high accuracy, having made it on Barstool and The Pat McAfee Show. The SPS can be found here, and future projected SPS grades can be unlocked here.

Don’t just draft for this year. Gain the knowledge needed to position yourself to secure your future with SPS rookie data.
For our statistical analyses, we calculated a Pearson coefficient value of 0.039. This indicates no substantial correlation between a tight end’s college YAC/Rec and their potential future performance in fantasy football. We are hoping for a minimum of 0.1, or an inverse correlation maximum of -0.1 when we study world-class athletes as we are. For reference to something that everyone acknowledges matters in prospect scouting, and to show the accompanying Pearson value, QB draft capital prevailed a -0.219 Pearson value.
We have found no meaningful connection between college YAC/Rec and fantasy football success for Tight Ends. YAC/Rec should not be used as a definitive bust/success indicator. If anyone still believes in it for using alongside other metrics, then 4.9 to 7.3 YAC/Rec is what you should hope for in your favorite athletes.
Our series has always sought to push the boundaries of sports analytics. This latest installment reaffirms our commitment to uncovering the hidden dynamics that define the game. Every Saturday, we’ll dive into intriguing questions, bust myths, and settle debates with thorough analysis. We welcome your input. Therefore, please leave comments or reach out with topics you’re eager to see dissected. All of our research can be found on our Analytics Page. Up next on our agenda for Part 70 of “Does It Matter?” is an examination of Tight End Average Depth of Target (ADOT): Does it matter? If so, what’s the ADOT threshold necessary for NFL success? Mark your calendars; every Saturday we shed light on the topics that matter to you. All it takes is a quick question being asked and we will go to work for you!


BrainyBallers Buy-Hold-Sell Chart (All Players)
Commanders WR battle 2026: rookie Antonio Williams and value bet Treylon Burks chase the WR2 job opposite Terry McLaurin in Jayden Daniels’ offense.

The 2026 Cowboys WR depth chart, role by role: CeeDee Lamb anchors, George Pickens ascends, Ryan Flournoy sleeps, and everyone else gets squeezed.

Saints WR depth chart 2026: rookie Jordyn Tyson is carving a No. 2 role behind Chris Olave at OTAs, with Juwan Johnson anchoring the passing game.