
Commanders WR Battle 2026: Williams, Burks Chase WR2
Commanders WR battle 2026: rookie Antonio Williams and value bet Treylon Burks chase the WR2 job opposite Terry McLaurin in Jayden Daniels’ offense.


For our extensive 68-part series, “Does It Matter?”, we have yet another interesting topic: can a Tight End’s college career Yards Per Route Run (Y/RR) can predict their future success in the NFL? By crunching numbers and applying standard statistical analysis, we discovered intriguing patterns that absolutely can aid in player evaluations. Here’s a detailed breakdown of our study.
Our analysis began by examining the top 50 fantasy football finishers since 2003, focusing on PPR fantasy scores. We defined “bottom 10”, which you will see throughout this study, as players finishing 41st-50th each season. For our Y/RR data, we used PFF and looked at the career Y/RR number, not just the best or senior season Y/RR.
Why did we choose the top 50? We aimed to find a “happy medium.” Extending further than the top 50 would have included fringe roster players, unlikely to score in the top 10, which would only skew the data. Conversely, we still wanted to compare the worst to the best. Therefore, we focused on comparing the 41st-50th place finishers to the top 10.
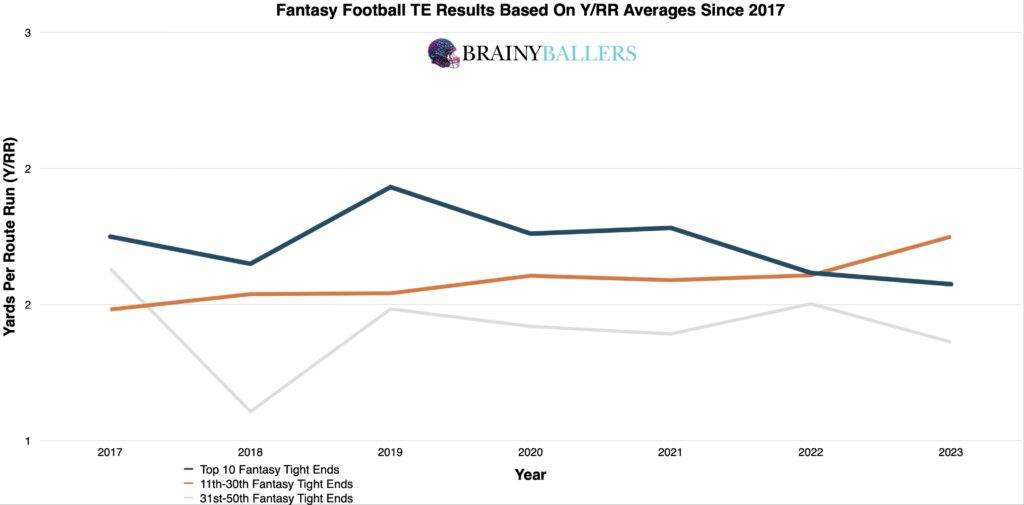
To begin, we categorized finishers into three groups based on their placement in fantasy leaderboards: top 10, 11-30th, and 31-50th. From this analysis, one conclusion became apparent: higher Yards Per Route Run (Y/RR) generally resulted in better NFL fantasy scores. In every one of the seven seasons studied, the top 10 finishers had higher college career Y/RR’s than those in the 41st-50th positions. This pattern suggests a possible predictive value in college Y/RR metrics.
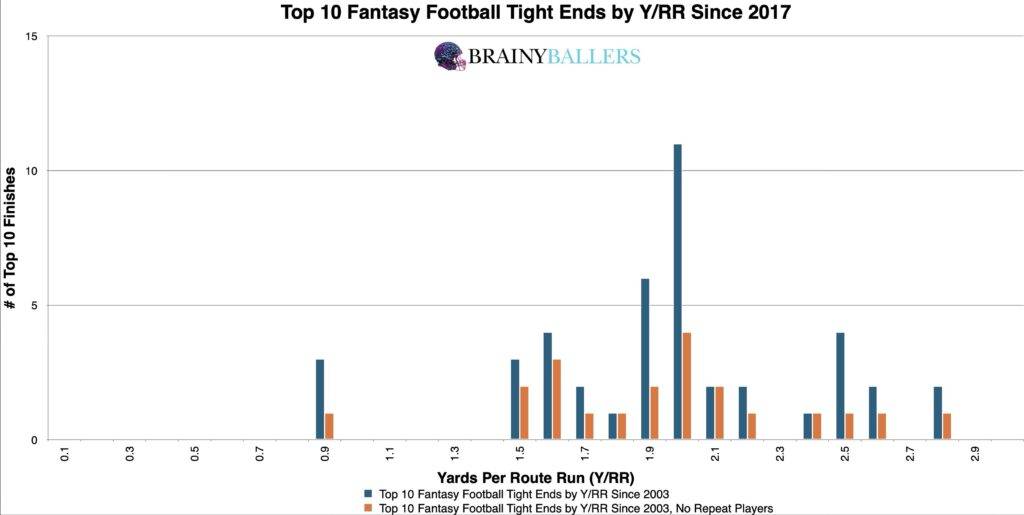
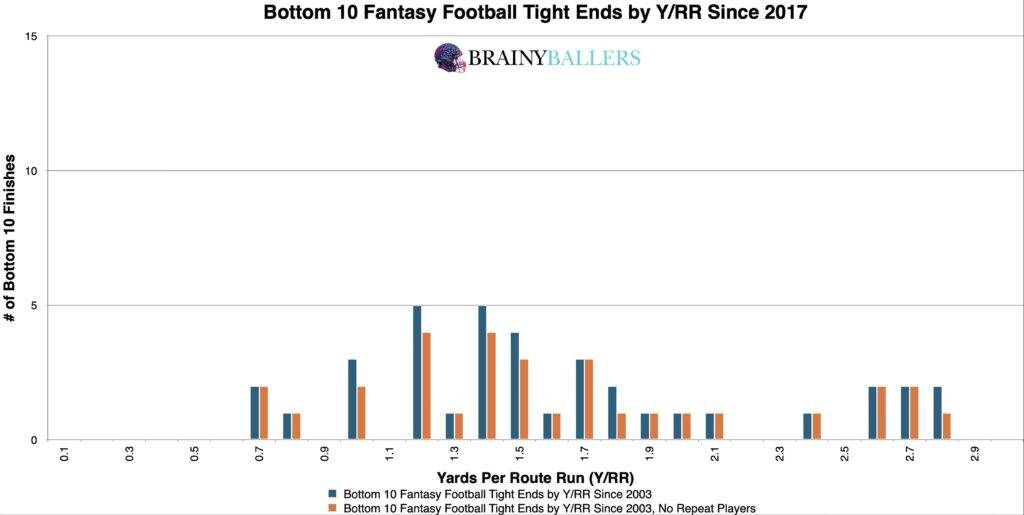
Next, we segmented the data for the top and bottom 10 finishers since 2017, segmenting it out in 0.1 Y/RR increments. This granular approach helped in seeing obvious visual trends to which reinforced our initial findings – higher Y/RR’s tend to correlate with greater fantasy success, evident from the distribution and weight comparisons between both of these charts.
To predict future NFL performances through a Tight End’s college Yards Per Route Run (Y/RR), we needed to find a performance threshold where the most significant improvements occur. Our challenge was to determine a range that has historically signaled top-level consistency and minimizes the appearance of unique players, focusing solely on consistent performers.
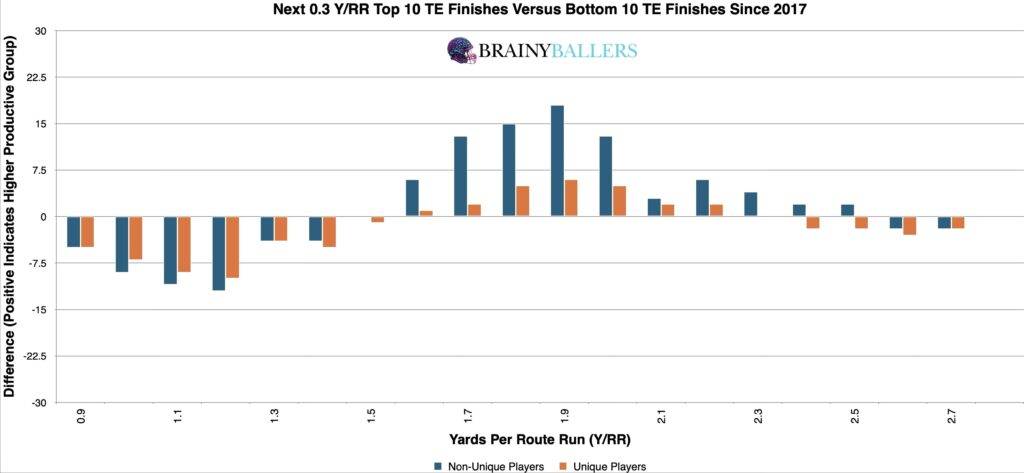
To achieve this, we developed a differences chart. This chart compared each Y/RR, adding the next 0.3 Y/RR, and subtracting the bottom 10 results from the top 10 within that group. The chart’s desired outcome is a negative number for unique differences (Orange) and a positive number for non-unique differences (Blue). This would indicate the top level consistency we are hoping for. It helped us identify where the performance significantly improves based on Y/RR, which appears to be 1.6 and above Y/RR. We will next attempt to verify this or debunk it as the top producing threshold.
From our analysis, a Y/RR of 1.6 and above initially appeared promising as a potential top-performing range. The differences chart approach allowed us to narrow down and adjust the figures within our spreadsheet to nearby ranges. After testing numbers close to this identified range, we found that setting the threshold at 1.5 Y/RR and above results in a 39.0% higher top 10 appearance rate compared to the bottom 10 historically. This therefore will be what you should look for in athletes and will be included in our Ultimate Athlete Blueprints, which offers an easy-to-read table housing all of our researched metrics combined in one place for you to view as seen here:

Due to these findings, Y/RR could play a factor in our Star-Predictor Score (SPS) model. The Star-Predictor Score (SPS) is a scouting tool designed to maximize investment potential and reduce risks when drafting rookies in Fantasy Football. It is proven to have a higher accuracy than draft capital alone to predict fantasy football success. The SPS includes 13 to 17 metrics, with the exact number varying by the player’s position. All these metrics are pre-NFL – some of which are proprietary to BrainyBallers – providing a complete analysis of a player’s analytical profile. The SPS gained widespread notoriety for its high accuracy, having made it on Barstool and The Pat McAfee Show. The SPS can be found here, and future projected SPS grades can be unlocked here.

Don’t just draft for this year. Gain the knowledge needed to position yourself to secure your future with SPS rookie data.
Applying standard statistical methods, we were able to substantiate the predictability that college career Y/RR has. That can be seen here:
This Pearson value shows a strong correlation between a Tight End’s college Y/RR and future fantasy production, meaning as a players college career Y/RR increases, typically their fantasy production in the NFL does as well. We are hoping for a minimum of 0.1, or an inverse correlation maximum of -0.1 when we study world-class athletes as we are. For reference to something that everyone acknowledges matters in prospect scouting, and to show the accompanying Pearson value, QB draft capital prevailed a -0.219 Pearson value.
By focusing on the Y/RR threshold of 1.5 and above, we can better evaluate and understand the potential of Tight Ends heading into the NFL.
While the results of our analysis presents a significant predictive tool, it’s important to remember that this information should only aid decision-making, not dictate it. Factors beyond Yards Per Route Run also contribute to a player’s success in the NFL.
Our series has always sought to push the boundaries of sports analytics. This latest installment reaffirms our commitment to uncovering the hidden dynamics that define the game. Every Saturday, we’ll dive into intriguing questions, bust myths, and settle debates with thorough analysis. We welcome your input. Therefore, please leave comments or reach out with topics you’re eager to see dissected. All of our research can be found on our Analytics Page. Up next on our agenda for Part 69 of “Does It Matter?” is an examination of Tight End YAC/Rec: Does it matter? If so, what’s the YAC/Rec threshold necessary for NFL success? Mark your calendars; every Saturday we shed light on the topics that matter to you. All it takes is a quick question being asked and we will go to work for you!


BrainyBallers Buy-Hold-Sell Chart (All Players)
Commanders WR battle 2026: rookie Antonio Williams and value bet Treylon Burks chase the WR2 job opposite Terry McLaurin in Jayden Daniels’ offense.

The 2026 Cowboys WR depth chart, role by role: CeeDee Lamb anchors, George Pickens ascends, Ryan Flournoy sleeps, and everyone else gets squeezed.

Saints WR depth chart 2026: rookie Jordyn Tyson is carving a No. 2 role behind Chris Olave at OTAs, with Juwan Johnson anchoring the passing game.