
Commanders WR Battle 2026: Williams, Burks Chase WR2
Commanders WR battle 2026: rookie Antonio Williams and value bet Treylon Burks chase the WR2 job opposite Terry McLaurin in Jayden Daniels’ offense.


For our 73-part “Does It Matter?” series, we dove into the statistics to explore whether the college drop rate of Wide Receivers can help predict their future success in the NFL. By analyzing data since 2016, we identified patterns and trends to provide insights into how drop rates influence a WR’s professional career. This analysis can aid in making informed decisions between players. Here are all our findings:
For our analysis, we examined the top 50 fantasy football finishers since 2016, utilizing PPR (Points Per Reception) fantasy scores. Our analysis included what we call the “bottom 10,” defined as the 41st-50th finishers each season. All of our drop rate data was career college data, not top or senior season, and is from PFF.
Why the top 50? We aimed for a “happy medium.” Extending beyond the top 50 would bring us to fringe roster players, who are clearly not contenders for the top 10 and would only distort the data. Conversely, our goal was to contrast the best with the worst, necessitating a comparison range that significantly differs from the top 10. Therefore, we went down to the top 50 and then looked at players finishing in the 41st-50th spots to effectively compare the worst against the top 10 performers.
To begin, we created an averages charts for 3 different segments: top 10, 11th-30th, and 31st-50th place finishers since 2016. From this analysis, a clear trend emerged: lower college drop rates are typically associated with higher fantasy scores. Notably, in all eight seasons analyzed, the top 10 finishers consistently posted lower drop rates than those ranking 31st-50th.

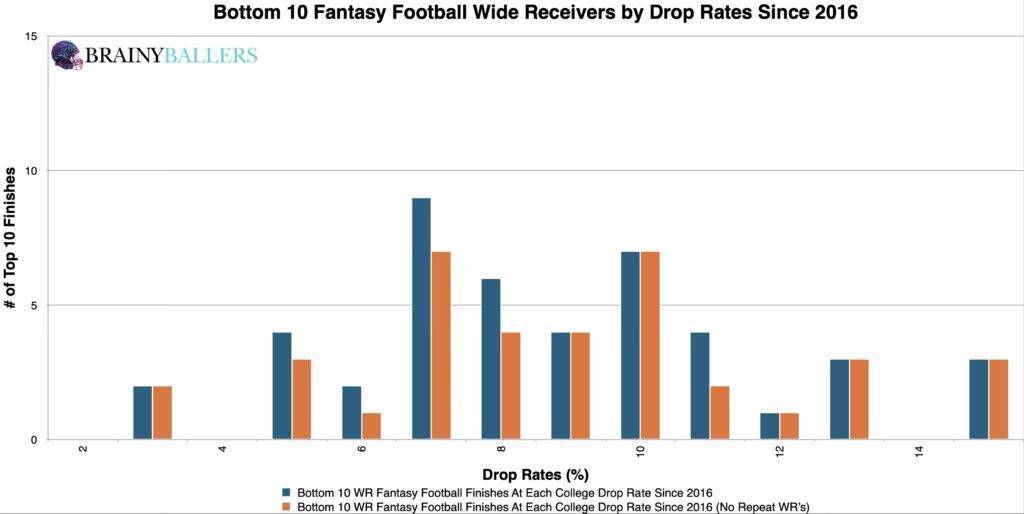
To further substantiate our findings, we examined the top and bottom 10 finishers dating back to 2016, segmenting the data out by 1.0 drop rate increments. This segmentation revealed a clear pattern as well: lower drop rates typically coincided with higher fantasy scores. Comparing the weight and distribution of drop rates within these charts is how you can come to that conclusion yourself.

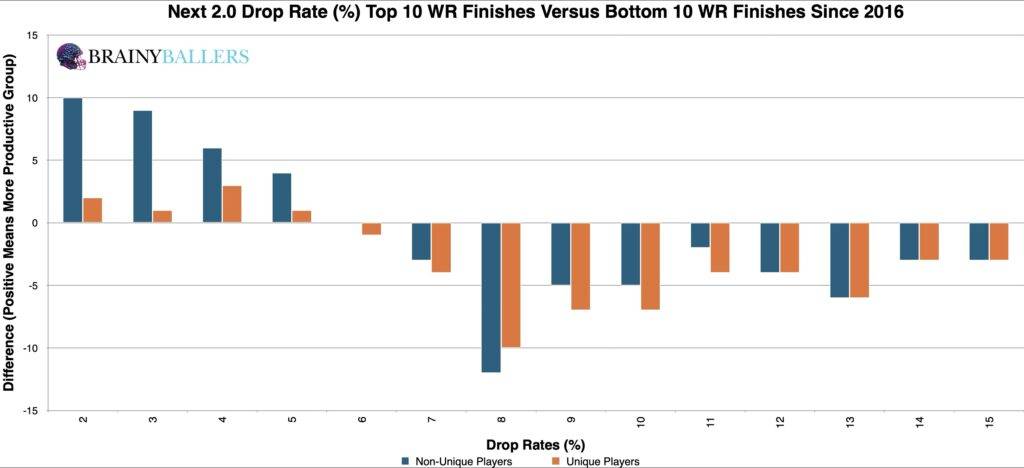
One of the biggest insights we always look to deliver viewers is to pinpoint an applicable threshold for college drop rates. This threshold would be an established range that historically signal top-level production more times than not. To do this, we crafted a differences chart which compares each drop rate with the subsequent 2.0 percent, then subtracts the bottom 10 results from the top 10 within each of those groupings. The chart’s desired outcome is a negative number for unique differences (Orange) and a positive number for non-unique differences (Blue). This would indicate the top level consistency we are hoping for. This analysis suggested that a drop rate of 7.0 or below could potentially be the top-performing athlete optimal range we are looking for, which we will attempt to verify or debunk next.
To refine our initial findings and ensure accuracy in what our optimal range is, we made range adjustments to test several other thresholds. This method allowed us to ensure that the data precisely identified the highest producing range for potential top-level WR talent. Our analysis initially suggested that a drop rate of 7.0 or below could potentially signal top-performing athletes. However, after refining our findings, we found that narrowing our optimal range to a 7.5 drop rate or below prevailed the highest producing optimal range. Specifically, this adjustment resulted in a 34.7% higher appearance rate within the top 10 compared to the bottom 10 finishers. Therefore, this will be our optimal range for WR drop rates and will be included in our Ultimate Athlete Blueprints, which offers an easy-to-read table housing all of our researched metrics combined in one place for you to view as seen here:

Due to these findings, Drop Rates could play a factor in our Star-Predictor Score (SPS) model. The Star-Predictor Score (SPS) is a scouting tool designed to maximize investment potential and reduce risks when drafting rookies in Fantasy Football. It is proven to have a higher accuracy than draft capital alone to predict fantasy football success. The SPS includes 13 to 17 metrics, with the exact number varying by the player’s position. All these metrics are pre-NFL – some of which are proprietary to BrainyBallers – providing a complete analysis of a player’s analytical profile. The SPS gained widespread notoriety for its high accuracy, having made it on Barstool and The Pat McAfee Show. The SPS can be found here, and future projected SPS grades can be unlocked here.

Don’t just draft for this year. Gain the knowledge needed to position yourself to secure your future with SPS rookie data.
Our next statistical approach included calculating the Pearson value, yielding a result of -0.266. This means there is a strong inverse correlation between a WR’s college drop rate and future fantasy production, meaning as college drop rates decreased, typically the accompanying NFL fantasy production increased. This bolsters the use of drop rates as a predictor stat. We are hoping for a minimum of 0.1, or an inverse correlation maximum of -0.1 when we study world-class athletes as we are. For reference to something that everyone acknowledges matters in prospect scouting, and to show the accompanying Pearson value, QB draft capital prevailed a -0.219 Pearson value.
Our research into WR college drop rates found a strong correlation and an applicable threshold that aligns with historical patterns of consistent success. The 7.5 drop rate or below now serves as our benchmark for identifying top producing future WR talent.
Our series has always sought to push the boundaries of sports analytics. This latest installment reaffirms our commitment to uncovering the hidden dynamics that define the game. Every Saturday, we’ll dive into intriguing questions, bust myths, and settle debates with thorough analysis. We welcome your input. Therefore, please leave comments or reach out with topics you’re eager to see dissected. All of our research can be found on our Analytics Page. Up next on our agenda for Part 74 of “Does It Matter?” is an examination of Wide Receiver Contested Catch Rate: Does it matter? If so, what’s the contested catch rate threshold necessary for NFL success? Mark your calendars; every Saturday we shed light on the topics that matter to you. All it takes is a quick question being asked and we will go to work for you!


BrainyBallers Buy-Hold-Sell Chart (All Players)
Commanders WR battle 2026: rookie Antonio Williams and value bet Treylon Burks chase the WR2 job opposite Terry McLaurin in Jayden Daniels’ offense.

The 2026 Cowboys WR depth chart, role by role: CeeDee Lamb anchors, George Pickens ascends, Ryan Flournoy sleeps, and everyone else gets squeezed.

Saints WR depth chart 2026: rookie Jordyn Tyson is carving a No. 2 role behind Chris Olave at OTAs, with Juwan Johnson anchoring the passing game.