
Commanders WR Battle 2026: Williams, Burks Chase WR2
Commanders WR battle 2026: rookie Antonio Williams and value bet Treylon Burks chase the WR2 job opposite Terry McLaurin in Jayden Daniels’ offense.


Our 74 part “Does It Matter?” series dives deep into statistics to uncover potential predictors of success in the NFL. This article focuses on WR PFF contested catch rates during their college careers and its potential impact on their future success. Here are all of our findings from when we explored possible correlations between college contested catch rates and NFL fantasy football success.
To investigate the potential relationship between a WR’s PFF contested catch percentage and future success, we examined the top 50 fantasy football finishers from each season since 2020. Rankings were determined using PPR (points per reception) fantasy scores. We used PFF college career contested catch rates, not the top or senior season.
Why the top 50? We aimed for a “happy medium” by selecting only the top 50 players. Going beyond would bring us close to fringe roster players, who likely wouldn’t score in the top 10, therefore only skewing the data. Although, we still wanted to contrast the best with the worst which requires a range of players distinct from the top 10. This is why we focused on those finishing in 41st-50th place for comparison with the top 10.
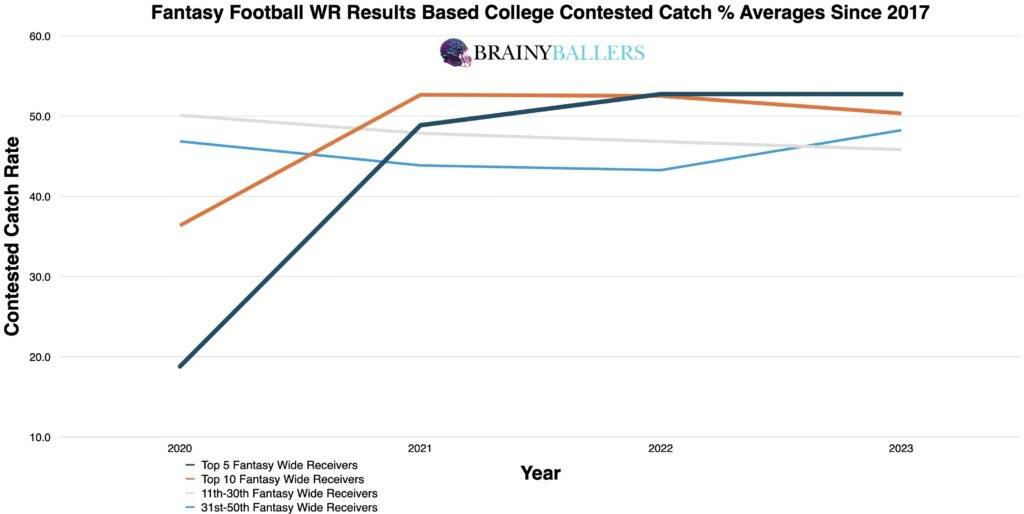
To begin, we compiled data on WR’s PFF contested catch percentages from college and their corresponding fantasy finishes to create an averages chart. This focused on average scores from top 5, top 10, 11th-30th, and 31st-50th finishers for each season since 2020. While doing this, the subtle pattern we noticed indicated that higher contested catch rates often correlated with higher fantasy scores. Notably, in 3 out of 4 seasons examined, the top 10 fantasy finishers had higher college contested catch rates compared to those in the 31st-50th positions. Although a very small sample size, this is a pattern we at least took under consideration going forward for our study.
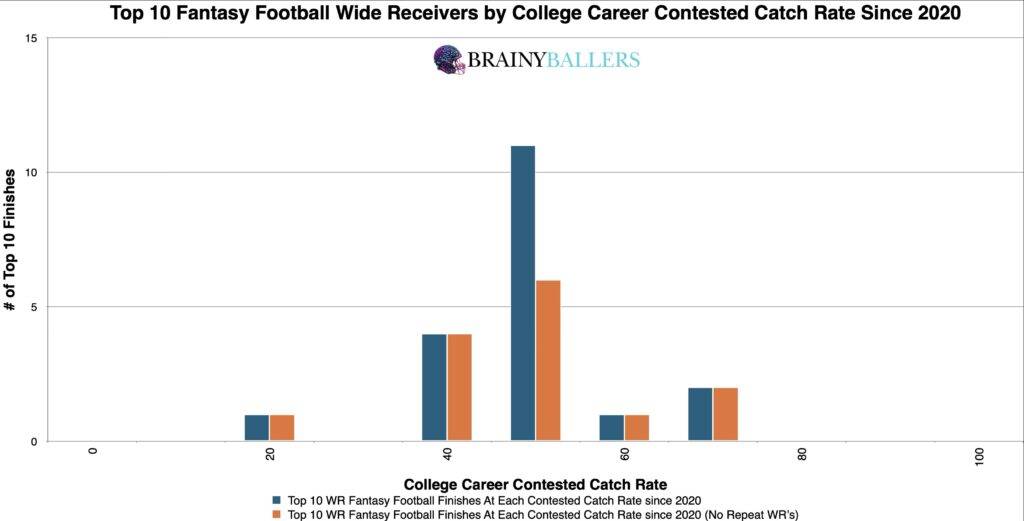
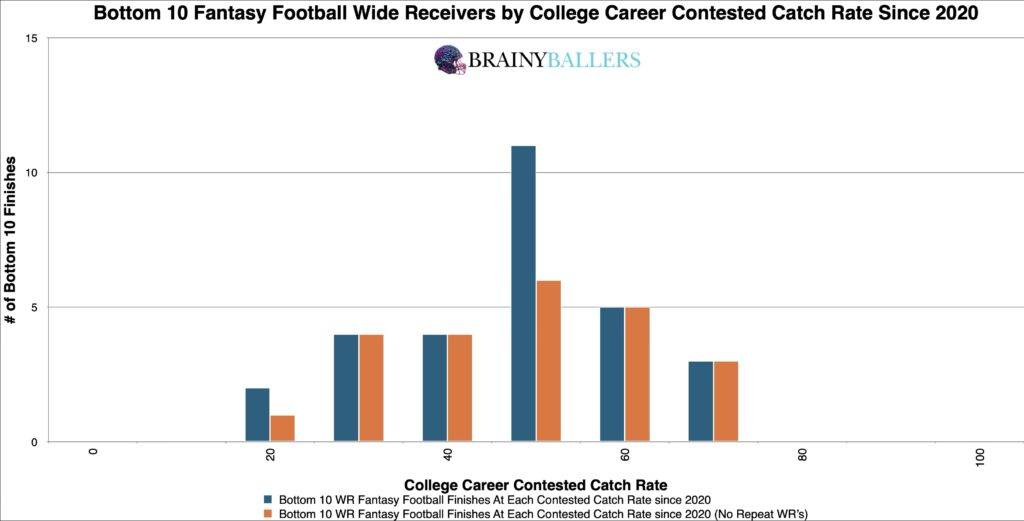
Next, we wanted to identify trends by segmenting contested catch rates into increments and comparing the top and bottom 10 charts after doing this. This segmentation did not help in determining the influence of contested catch success during college on NFL performance, as the weight and distribution of both the top and bottom 10 charts is too similar, as you can see here:
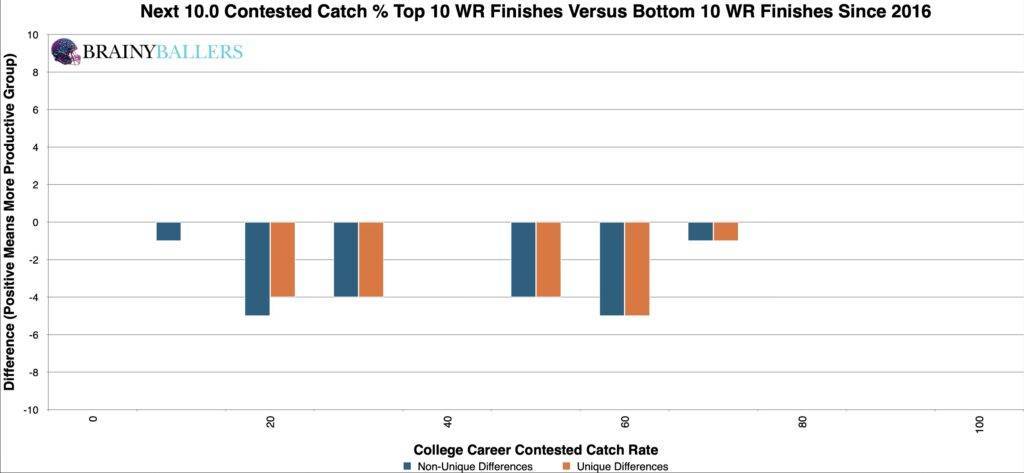
To achieve our goal of finding an applicable threshold where increased performances typically occur, we constructed a differences chart. This chart allows us to compare each contested catch rate and the subsequent 10 percent while subtracting the bottom 10 results from the top 10 within that range. The chart’s desired outcome is a negative number for unique differences (Orange) and a positive number for non-unique differences (Blue). This would indicate the top level consistency we are hoping for. Through this analysis, the big takeaway was that since 40% is even and the rest are negative, that could possibly be the top performing threshold we are looking for, which we will next attempt to verify or alter this to find a higher producing range.
We made range adjustments to our initially identified optimal range to test nearby ranges. After testing numbers around the initial range revealed by our differences chart, we refined the optimal range to a 41% and above contested catch rate. This adjustment resulted in a 20.5% higher historic likelihood of appearing in the top 10 compared to the bottom 10.
From this, we concluded that aiming for a contested catch rate of 41% or higher is optimal for predicting consistent athletes. This range has become the optimal range for WR PFF contested catch rates and will be included in our Ultimate Athlete Blueprints, which offers an easy-to-read table housing all of our researched metrics combined in one place for you to view as seen here:

Due to these findings, PFF’s contested catch rates could play a factor in our Star-Predictor Score (SPS) model. The Star-Predictor Score (SPS) is a scouting tool designed to maximize investment potential and reduce risks when drafting rookies in Fantasy Football. It is proven to have a higher accuracy than draft capital alone to predict fantasy football success. The SPS includes 13 to 17 metrics, with the exact number varying by the player’s position. All these metrics are pre-NFL – some of which are proprietary to BrainyBallers – providing a complete analysis of a player’s analytical profile. The SPS gained widespread notoriety for its high accuracy, having made it on Barstool and The Pat McAfee Show. The SPS can be found here, and future projected SPS grades can be unlocked here.

Don’t just draft for this year. Gain the knowledge needed to position yourself to secure your future with SPS rookie data.
Here are the findings from our standard statistical tests:
This indicates no strong correlation between a wide receiver’s college contested catch rate and their future fantasy production. We are hoping for a minimum of 0.1, or an inverse correlation maximum of -0.1 when we study world-class athletes as we are. For reference to something that everyone acknowledges matters in prospect scouting, and to show the accompanying Pearson value, QB draft capital prevailed a -0.219 Pearson value.
While our findings highlight intriguing trends, it’s essential to approach contested catch percentage as a complementary metric rather than a definitive success predictor. If you wish to use it you should hope your athletes have a 41% and above contested catch rate.
Our series has always sought to push the boundaries of sports analytics. This latest installment reaffirms our commitment to uncovering the hidden dynamics that define the game. Every Saturday, we’ll dive into intriguing questions, bust myths, and settle debates with thorough analysis. We welcome your input. Therefore, please leave comments or reach out with topics you’re eager to see dissected. All of our research can be found on our Analytics Page. Up next on our agenda for Part 75 of “Does It Matter?” is an examination of Wide Receiver Catch Radius: Does it matter? If so, what’s the catch radius threshold necessary for NFL success? Mark your calendars; every Saturday we shed light on the topics that matter to you. All it takes is a quick question being asked and we will go to work for you!


BrainyBallers Buy-Hold-Sell Chart (All Players)
Commanders WR battle 2026: rookie Antonio Williams and value bet Treylon Burks chase the WR2 job opposite Terry McLaurin in Jayden Daniels’ offense.

The 2026 Cowboys WR depth chart, role by role: CeeDee Lamb anchors, George Pickens ascends, Ryan Flournoy sleeps, and everyone else gets squeezed.

Saints WR depth chart 2026: rookie Jordyn Tyson is carving a No. 2 role behind Chris Olave at OTAs, with Juwan Johnson anchoring the passing game.