
Commanders WR Battle 2026: Williams, Burks Chase WR2
Commanders WR battle 2026: rookie Antonio Williams and value bet Treylon Burks chase the WR2 job opposite Terry McLaurin in Jayden Daniels’ offense.


For the next entry in our 72-part “Does It Matter?” series, we looked into the question of whether a wide receiver’s college yards per reception (Y/R) can help predict their NFL success. Here are all of our findings:
We structured our study by examining the top 50 fantasy football finishers since 2003, focusing on PPR (Points Per Reception) fantasy scores. When mentioning the “bottom 10” within this article, we are referring to the fantasy finishers ranked 41st to 50th each season.
Why the top 50? We aimed for a “happy medium” by choosing the top 50 only. Expanding further might include fringe roster players, who are unlikely to score in the top 10 and could only skew the data. Conversely, we wanted to contrast the worst with the best, requiring a range of players differing significantly from the top 10. Therefore, we included finishers ranked 41st-50th to compare with the top 10.
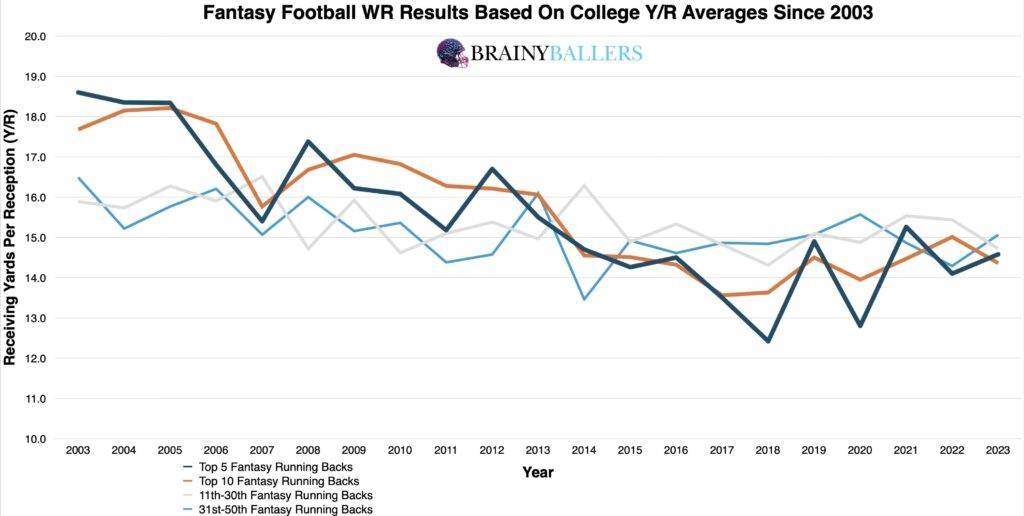
To begin our study, we created an averages chart which categorizes the top 5, 10, 11-30th, and 31-50th place finishers since 2003. This analysis was an attempt to identify any emerging NFL trends in collegiate Y/R, but the patterns were not obvious from this starting point. As you can see, in only 57.1% of seasons (12 out of 21), the top 10 finishers had higher college Y/R’s than those ranking 31st to 50th.
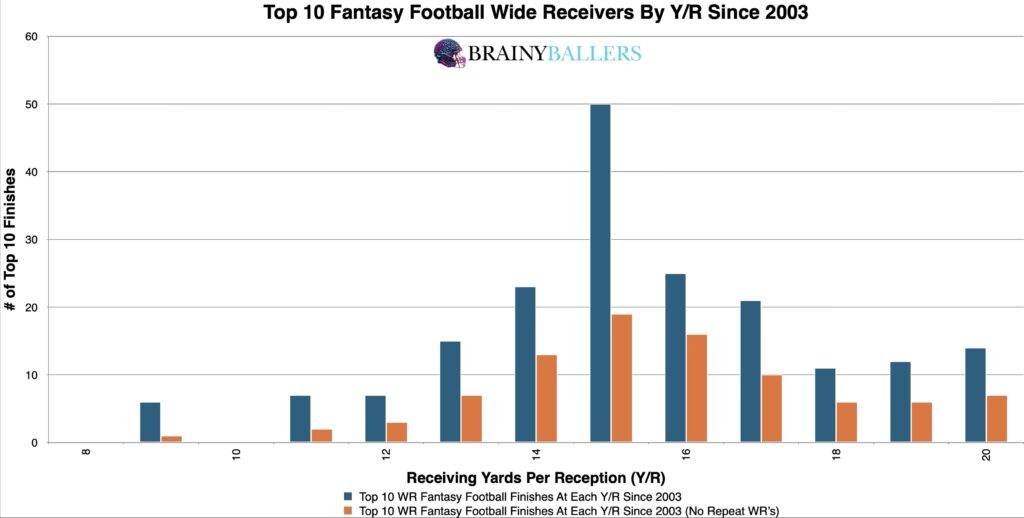
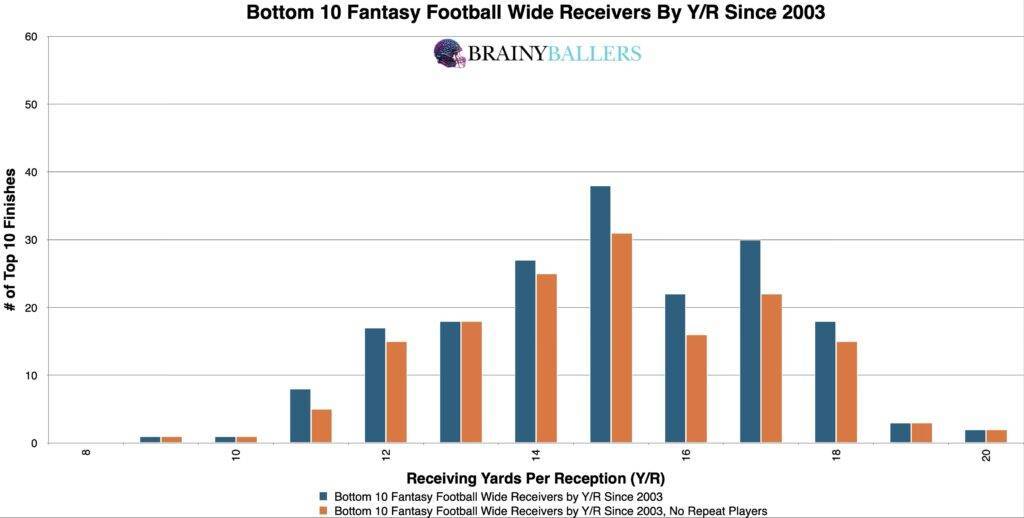
We further dove into the data by segmenting top 10 finishers since 2003 in 1.0-yard increments. This granular segmentation hoped to identify obvious correlations between college Y/R and NFL fantasy success. However, similar to our initial averages analysis, identifying a strong correlation proved challenging due to the weight and distribution of both these charts. You can see below the top 10 first, followed by the bottom 10 finishers:
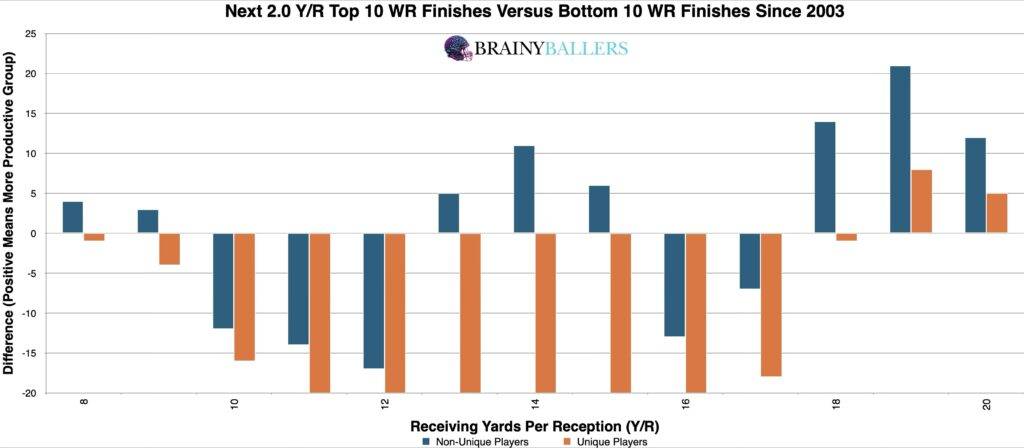
In our pursuit of identifying an applicable threshold for distinguishing top-performing receivers, we created a differences chart that compared each yardage per reception plus the next 2.0 yards, subtracting the results of the bottom 10 finishers from those in the top 10 within that group. The chart’s desired outcome is a negative number for unique differences (Orange) and a positive number for non-unique differences (Blue). This would indicate the top level consistency we are hoping for. From this analysis, the following pattern emerged: a reception average of 18 yards and above appeared to be indicative of top-level performances. This finding narrowed our focus, bringing us closer to determining an optimal range for consistent success.
To sharpen our initial insights, we made range adjustments to our previously mentioned optimal range. After testing various ranges near these initial findings, we found that adjusting the threshold to 18.6 yards per reception and above yielded a 13.5% higher appearance rate in the top 10 compared to the bottom 10. This makes it the ideal range you should look for in evaluating up and coming athletes and will be included in our Ultimate Athlete Blueprints, which offers an easy-to-read table housing all of our researched metrics combined in one place for you to view as seen here:

Due to these findings, Y/R could play a factor in our Star-Predictor Score (SPS) model. The Star-Predictor Score (SPS) is a scouting tool designed to maximize investment potential and reduce risks when drafting rookies in Fantasy Football. It is proven to have a higher accuracy than draft capital alone to predict fantasy football success. The SPS includes 13 to 17 metrics, with the exact number varying by the player’s position. All these metrics are pre-NFL – some of which are proprietary to BrainyBallers – providing a complete analysis of a player’s analytical profile. The SPS gained widespread notoriety for its high accuracy, having made it on Barstool and The Pat McAfee Show. The SPS can be found here, and future projected SPS grades can be unlocked here.

Don’t just draft for this year. Gain the knowledge needed to position yourself to secure your future with SPS rookie data.
Next, we applied standard statistical methods to assess the relationship between a receiver’s college yards per reception and their future NFL fantasy production. Our findings found a Pearson Value of 0.046, indicating no significant correlation. We are hoping for a minimum of 0.1, or an inverse correlation maximum of -0.1 when we study world-class athletes as we are. For reference to something that everyone acknowledges matters in prospect scouting, and to show the accompanying Pearson value, QB draft capital prevailed a -0.219 Pearson value.
To further look into the Y/R metric, a comparison across decades revealed a significant trend shift. Specifically, the optimal range identified for consistent top 10 finishes has diminished completely in the current decade. In other words, any trend that was there to support Y/R being used as a predictive metric is now entirely gone.
| 2004-2013 | |||
| Top 10 | 11 through 40 | Bottom 10 | |
| All count | 94 | 275 | 85 |
| All 1.5 and above | 30 | 29 | 4 |
| % (Optimal Range/all) | 31.9% | 10.5% | 4.7% |
| 2014-2023 | |||
| Top 10 | 11 through 40 | Bottom 10 | |
| All count | 99 | 292 | 97 |
| All 1.5 and above | 5 | 21 | 5 |
| % (Optimal Range/all) | 5.1% | 7.2% | 5.2% |
Our findings found that there is no correlation between college Y/R and future success. If you still wish to use this data alongside other metrics, you should hope for Wide Receivers with an 18.6 and above Y/R.
Our series has always sought to push the boundaries of sports analytics. This latest installment reaffirms our commitment to uncovering the hidden dynamics that define the game. Every Saturday, we’ll dive into intriguing questions, bust myths, and settle debates with thorough analysis. We welcome your input. Therefore, please leave comments or reach out with topics you’re eager to see dissected. All of our research can be found on our Analytics Page. Up next on our agenda for Part 73 of “Does It Matter?” is an examination of Wide Receiver College Drop Rates: Does it matter? If so, what’s the Drop Rate threshold necessary for NFL success? Mark your calendars; every Saturday we shed light on the topics that matter to you. All it takes is a quick question being asked and we will go to work for you!


BrainyBallers Buy-Hold-Sell Chart (All Players)
Commanders WR battle 2026: rookie Antonio Williams and value bet Treylon Burks chase the WR2 job opposite Terry McLaurin in Jayden Daniels’ offense.

The 2026 Cowboys WR depth chart, role by role: CeeDee Lamb anchors, George Pickens ascends, Ryan Flournoy sleeps, and everyone else gets squeezed.

Saints WR depth chart 2026: rookie Jordyn Tyson is carving a No. 2 role behind Chris Olave at OTAs, with Juwan Johnson anchoring the passing game.