
For part 39 of our “Does It Matter?” series, we looked into the impact of a Defensive Ends weight on their performance. Using our data, we applied standard statistical analysis methods and found an optimal weight range. Here are all of our findings:
Methodology
To structure our analysis, we collected the top 50 fantasy football finishers since 2003, excluding anyone who is listed as a Defensive Tackle. The term “bottom 10”, which you will see throughout this study, refers to those occupying the 41st-50th positions each season. All this data was sourced from the NFL Draft combine results.
Why the top 50? We wanted to maintain a “happy medium” by including enough players to avoid fringe roster players who would only skew results, yet still differentiate between the elite and those less successful.
Analyzing DE Weight Averages
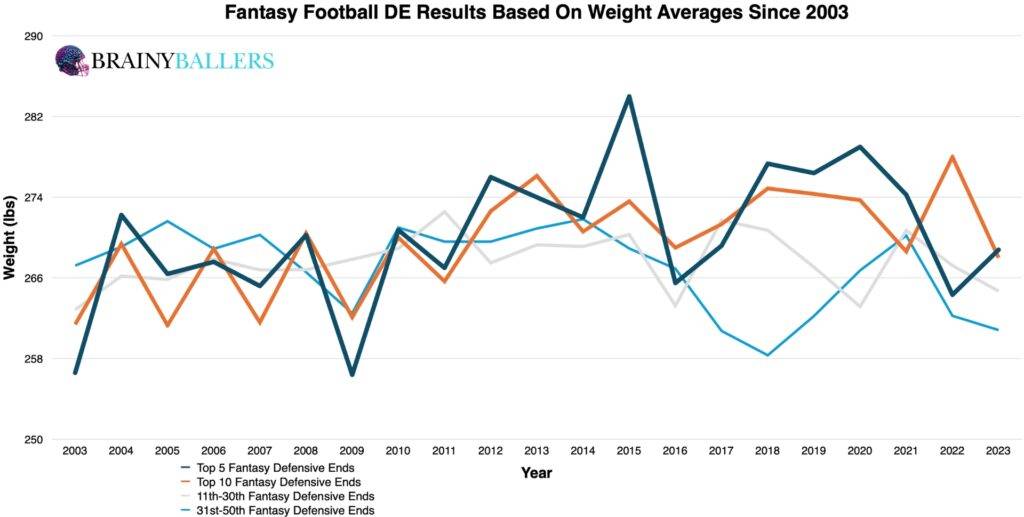
To begin, we calculated averages across different finisher brackets: top 5, top 10, 11-30th, and 31-50th finishers since 2003. From this, no clear trend emerged indicating higher or lower weights for top finishers. In 12 out of 21 seasons (57.1%), the top 5 had higher weights compared to those who finished 31st-50th. This raised questions about the influence of weight on DE performance, suggesting it might not be a valuable predictor.
Segmented Top & Bottom 10 Finishers Since 2003
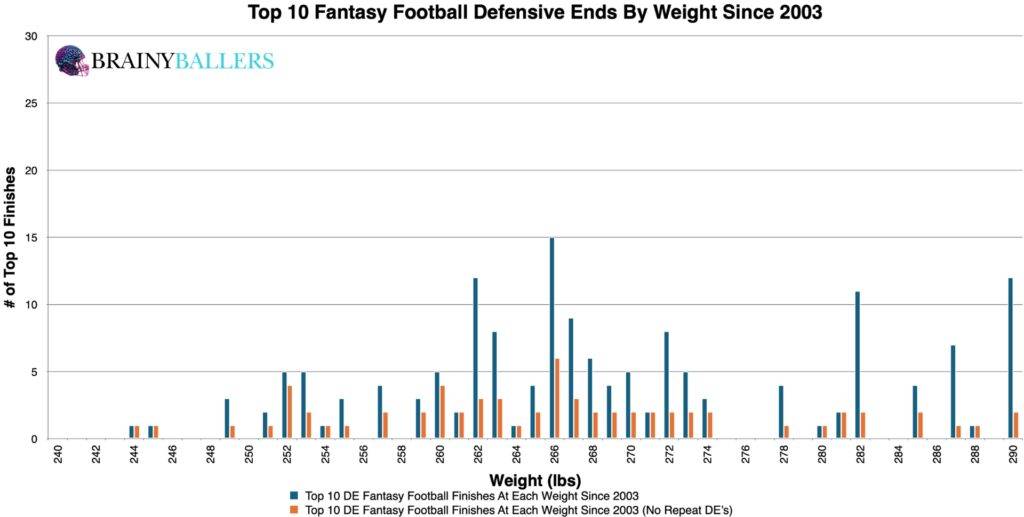
To dive deeper into the weight data, we segmented the top 10 finishers since 2003 into 1-pound increments. The top 10 chart appeared skewed towards higher weights, implying a possible advantage for heavier DEs.
DE Weight Differences Chart Analysis
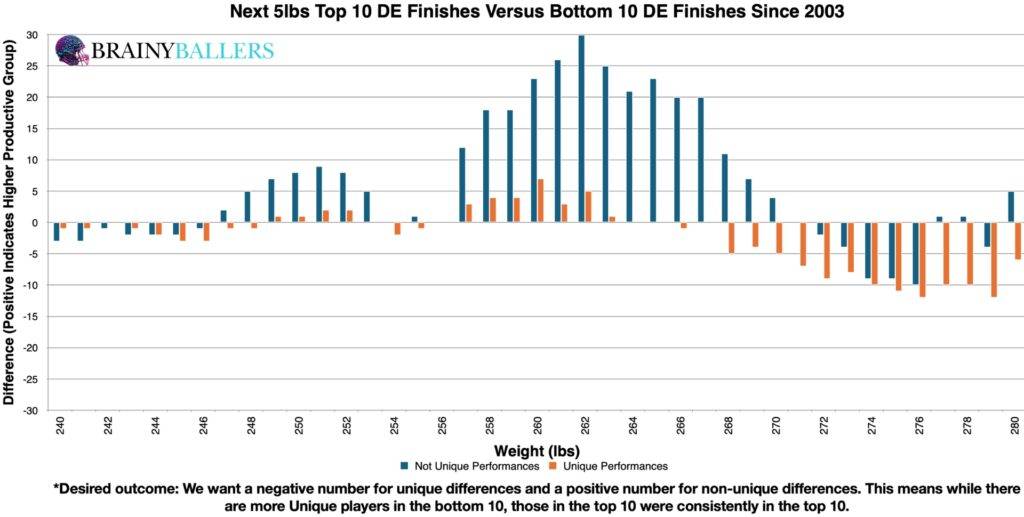
Our primary goal was to establish a weight range for defensive ends where higher performances occur. To do this, we created our differences chart which compared weight increments plus the next five pounds, subtracting the bottom 10 results from the top 10. The chart’s desired outcome is a negative number for unique differences (Orange) and a positive number for non-unique differences (Blue). This would indicate the top level consistency we are hoping for. From this analysis, 247-275lbs appears to be the optimal weight range. We will test this and other ranges to verify this as the top producing range, or find a better one.
Verifying the Optimal DE Weight Range
By altering the weight range to 251-272lbs, this yielded a 14.0% higher appearance rate in the top 10 compared to the bottom 10. This weight range will be the optimal range for DE Weights for our SPS model and will be the subject of this research going forward.
Star-Predictor Score (SPS) Predictive Model
Due to these findings, weight could play a factor in our Star-Predictor Score (SPS) model. Since 231lbs is the lowest seen since 2003 in the top 10, this will be the critical value for the SPS. The Star-Predictor Score (SPS) is a scouting tool designed to maximize investment potential and reduce risks when drafting rookies in Fantasy Football. It is proven to have a higher accuracy than draft capital alone to predict fantasy success. The SPS includes 13 to 17 metrics, with the exact number varying by the player’s position. All these metrics are pre-NFL, and some are invented by us, providing a complete analysis of a player’s analytical profiles. The SPS gained widespread notoriety for its high accuracy, having made it on Barstool and The Pat McAfee Show. The SPS can be found here.
DE Weight Pearson Value
For standard statistical methods, we calculated a Pearson Value of 0.0183. This indicates no significant correlation between a DE’s weight and fantasy performance. We are hoping for a minimum of 0.1, or an inverse correlation maximum of -0.1 when we study world-class athletes as we are. For reference to something that everyone acknowledges matters in prospect scouting, and to show the accompanying Pearson value, QB draft capital prevailed a -0.219 Pearson value.
Decadal Differences
We next wanted to assess the significance of the identified DE weight range for top 10, 11-40th, and bottom 10 finishers by applying our optimal range across the last 2 decades. From this, you can see that this is actually a dying trend by using the B10 to T10 difference.
| 2004-2013 | |||
| Top 10 | 11 through 40 | Bottom 10 | |
| All count | 84 | 193 | 50 |
| All between 251-272lbs | 54 | 99 | 18 |
| % (Optimal Range/all) | 64.3% | 51.3% | 36.0% |
| 2014-2023 | |||
| Top 10 | 11 through 40 | Bottom 10 | |
| All count | 80 | 168 | 53 |
| All between 251-272lbs | 43 | 91 | 30 |
| % (Optimal Range/all) | 53.8% | 54.2% | 56.6% |
Start Dominating Rookie Drafts!
What 3 metrics matter the most when scouting a rookie Quarterback?What threshold should Quarterbacks achieve within those metrics to be considered an elite prospect?How much should you value those stats above all other stats?Couldn't answer those questions? Rest easy, we have it handled for you.That's what this chart answers. Sort by importance and/or filter by position. Unlock by signing up with the links provided. $9.99/Year or $24.99 Lifetime access. Cancel anytime.
Conclusion
From this study, we narrowed down the optimal range for DE Weights to 251-272lbs. Standard statistical methods show no correlation, so nobody should be using weights to evaluate Defensive Ends solely. Further, we found this to be a dying trend across the last two decades, further decreasing the predictable power of weights for Defensive Ends.
More Data Next Week!
Our series has always sought to push the boundaries of sports analytics. This latest installment reaffirms our commitment to uncovering the hidden dynamics that define the game. Every Saturday, we’ll dive into intriguing questions, bust myths, and settle debates with thorough analysis. We welcome your input. Therefore, please leave comments or reach out with topics you’re eager to see dissected. All of our research can be found on our Analytics Page. Up next on our agenda for Part 40 of “Does It Matter?” is an examination of Defensive End 40 Yard Dashes: Does it matter? If so, what’s the 40-time threshold necessary for NFL success? Mark your calendars; every Saturday we shed light on the topics that matter to you. All it takes is a quick question being asked and we will go to work for you!


Related Content:
BrainyBallers Buy-Hold-Sell Chart (All Players)
Get Your Products 100% Refunded By Predicting The Next SuperBowl Winner!