
In part 7 of our “Does It Matter?” series, we ventured into our first Running Back data to figure out if weight matters for NFL running backs and to uncover any correlations. Excitingly, we discovered an optimal range that could influence your favorite player’s success. Here are all of our findings:
Methodology: Consistency and Precision
To ensure consistency, we relied exclusively on NFL Draft Combine numbers and analyzed the top 50 fantasy football finishers since 2003. All of our data is based on PPR scoring system. Our approach included:
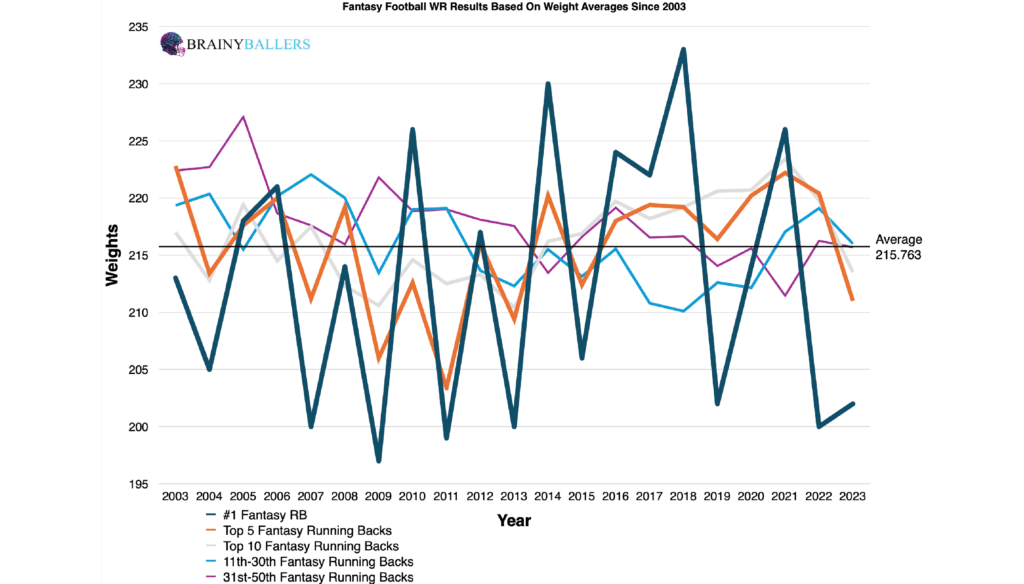
- Averages Chart: We averaged stats for the top 1, 5, 10, 11-30, and 31-50 finishers since 2003. This averages chart shows no definitive trend other than a recent increase in weight among the top 5 and 10 performers.
Segmented Chart Insights: Pounds Matter
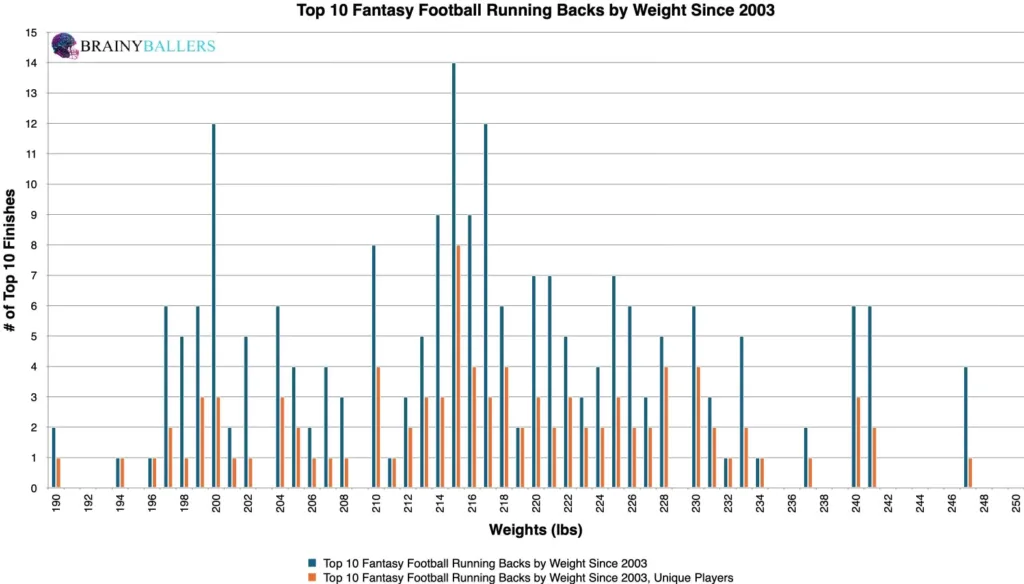
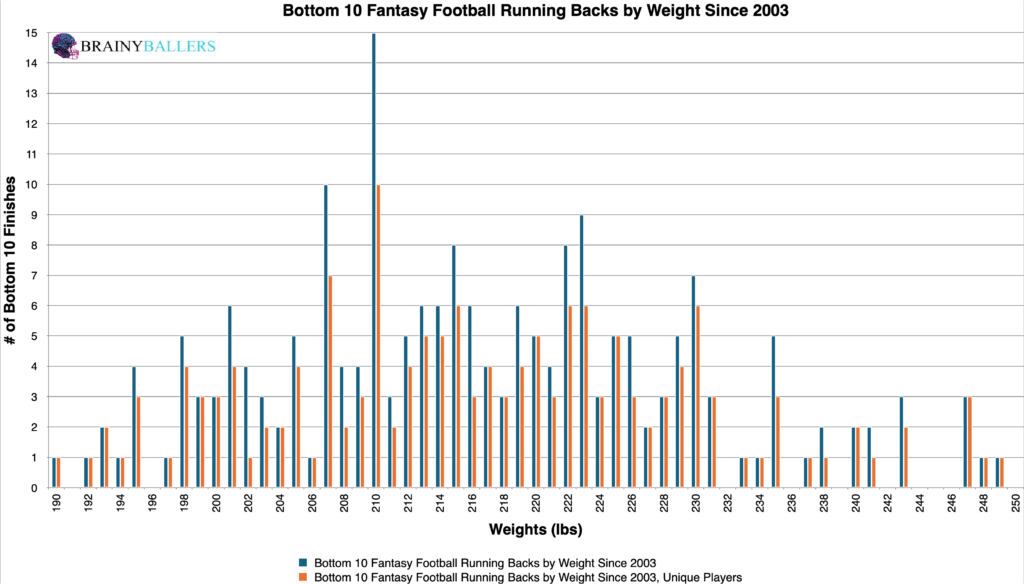
Next, we segmented the top 10 and bottom 10 finishers by weight, comparing each pound. The bottom 10 is defined as fantasy football finishers 41-50 each season. When we did this, we discovered significant increases in production at certain specific weights. Notably, 213 and 214 pounds showed the most significant increase in performance, hinting at a potential hard range. Additionally, around 196 pounds a smaller yet notable increase suggested a possible soft zone.
Comparing Top and Bottom Performers
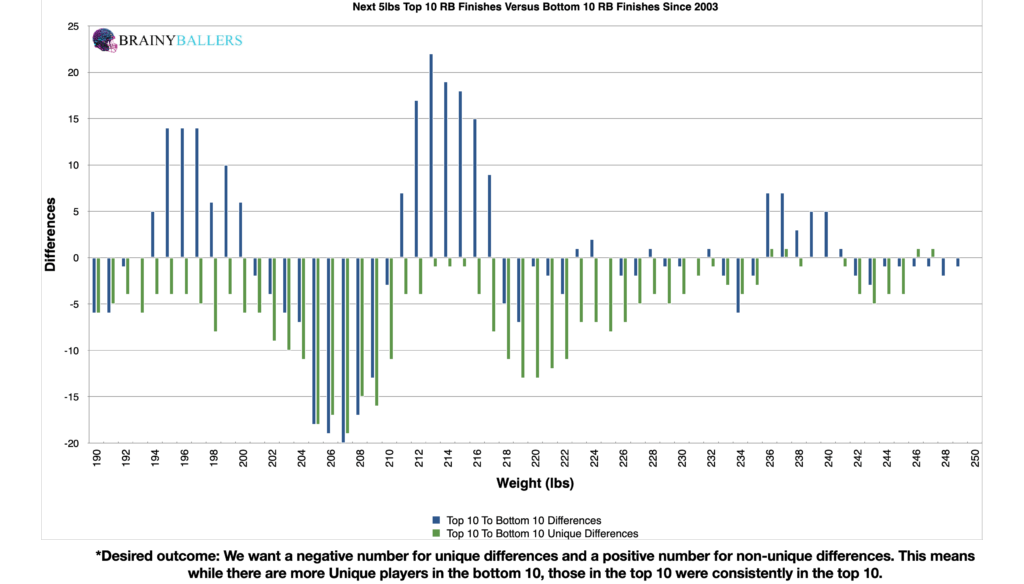
To add depth to our findings, we constructed a differences chart. This compares each weight segment and the next 5 pounds among the top finishers while subtracting the corresponding data from the bottom 10. Essentially, the Top 10 finishers chart minus the Bottom 10 Finishers chart (seen above) for each 5 pounds beginning at the indicated weight. In this chart, you will see both unique and non-unique players that showed up in our data. The chart’s desired outcome is a negative number for unique differences and a positive number for non-unique differences. This desired outcome would show that when NFL Running Backs show up in the top 10, they are most likely to show up again.
Hard and Soft Ranges: Optimal RB Weights
This differences chart helped reveal two prominent weight ranges where RBs excelled. The soft range is where a smaller performance increase occurs but is still recognizable, and the hard range is where the highest performance increase occurs. Those ranges are indicated below, as taken from the differences chart:
Soft Range: 194-205 Pounds
Hard Range: 211-222 Pounds
Most Common RB Weight, Or Most Common Top Performing RB Weight?
Diving into the data further, we compared this hard weight range against the overall average of running backs in both the bottom 10 and top 10. In the bottom 10, there were 207 running backs with a weight measurement. 63 of these running backs fell within this hard range, account for 30.4%. This establishes a baseline to see if we found an average NFL running back weight, or if we found an average top performing NFL running back weight. A great revelation was made when examining the top 10 finishers from 2003 to 2023: 80 out of 210 finishers resided within this weight bracket, representing 38.1%. This accounts for a 7.7% increase over the bottom 10 baseline!
Verifying the Optimal RB Weight Range: Fine-Tuning
This fine-tuning ability helps us ensure we’ve identified the highest-producing range. After testing various numbers close to our initial findings, we found that adjusting the range to 214-221lbs resulted in a 11.1% higher occurrence in the top 10 than in the bottom 10. This range will be the subject of this article going forward.
Star-Predictor Score (SPS) Predictive Model
Due to these findings, weight could play a factor in our Star-Predictor Score (SPS) model. The Star-Predictor Score (SPS) is a scouting tool designed to maximize investment potential and reduce risks when drafting rookies in Fantasy Football. It is proven to have a higher accuracy than draft capital alone to predict fantasy success. The SPS includes 13 to 17 metrics, with the exact number varying by the player’s position. All these metrics are pre-NFL, and some are invented by us, providing a complete analysis of a player’s analytical profiles. The SPS gained widespread notoriety for its high accuracy, having made it on Barstool and The Pat McAfee Show. The SPS can be found here.
RB Weight Pearson Value
As far as standard statical methods, we found a Pearson value of -0.041 between RB Weights and their corresponding fantasy football scores. This value shows strong correlation between a Wide Receivers’ hand size and their fantasy production. We are hoping for a minimum of 0.1, or an inverse correlation maximum of -0.1 while studying world-class athletes as we are. For reference to something that everyone acknowledges matters in prospect scouting, and to show the accompanying Pearson value, RB draft capital prevailed a -0.234 Pearson value.
Decade Trends: Hard Range Over Time
We also analyzed trends over two decades to understand the evolving significance of these weight ranges. Between 2004-2013 and 2014-2023, and including the soft range, the breakdown is as follows:
| 2004-2013 | |||
| Top 10 | 11 through 40 | Bottom 10 | |
| All count | 100 | 300 | 100 |
| Between 214 and 221 | 33 | 86 | 19 |
| % (hard zone/all) | 33.0% | 28.7% | 19.0% |
| 2014-2023 | |||
| Top 10 | 11 through 40 | Bottom 10 | |
| All count | 100 | 300 | 100 |
| Between 214 and 221 | 29 | 62 | 22 |
| % (hard zone/all) | 29.0% | 20.7% | 22.0% |
These trends indicate a consistent drop in the bottom 10 RBs across both decades. Further, it appears as though this weight range was more significant in the earlier decade.
Further Insights: Averages & Medians
To have some extra fun, we found that the average weight for all athletes in our data was 217 pounds. Also, the median time was 216 pounds.
Start Dominating Rookie Drafts!
What 3 metrics matter the most when scouting a rookie Quarterback?What threshold should Quarterbacks achieve within those metrics to be considered an elite prospect?How much should you value those stats above all other stats?Couldn't answer those questions? Rest easy, we have it handled for you.That's what this chart answers. Sort by importance and/or filter by position. Unlock by signing up with the links provided. $9.99/Year or $24.99 Lifetime access. Cancel anytime.
Conclusion
Our in-depth analysis suggests that weighing between 214-221 pounds provides a slight performance boost historically to running backs. This should be used as a tool to supplement your research of players.
More Data Next Week!
Our series has always sought to push the boundaries of sports analytics, and this latest installment reaffirms our commitment to uncovering the hidden dynamics that define the game. Every Saturday We will dive deep into the most intriguing questions, bust myths, and settle debates with thorough analysis similar to this. We thrive on curiosity and welcome your input — so please, leave comments or reach out to us with topics you’re eager to see dissected next. All of our research can be found on our Analytics Page. Up next on our agenda for Part 8 of “Does It Matter? is our next examination of Running Backs: Does BMI matter? If so, what’s the ideal BMI for a RB? Mark your calendars; every Saturday we shed light on the topics that matter to you. All it takes is a short question and we will go to work for you!