
Tight Ends: Can Yards Per Route Run (Y/RR) Help Predict Their NFL Success?
For our extensive 68-part series, “Does It Matter?”, we have yet another interesting topic: can a Tight End’s college career Yards Per


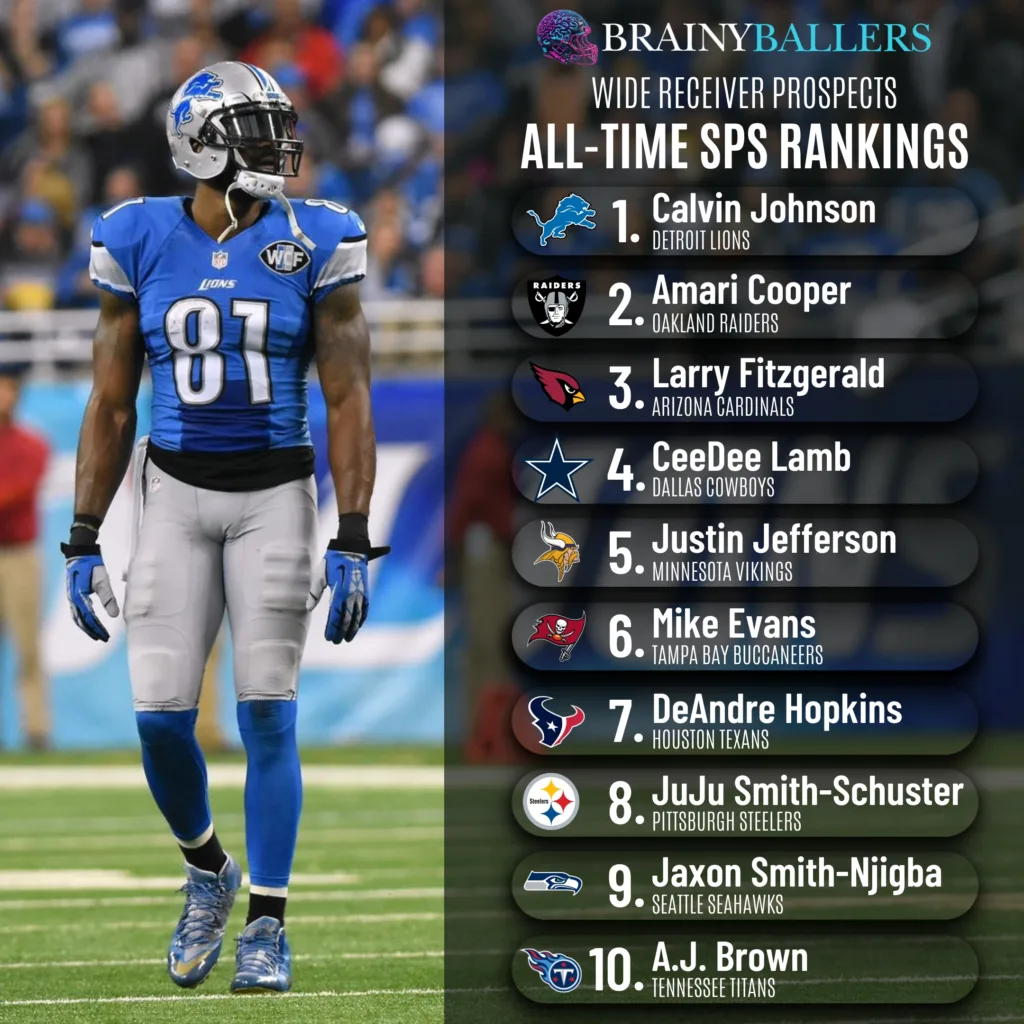
For the 48th part in our “Does It Matter?” series, we examined whether the model we’ve developed — thanks in large part to the constructive feedback from our viewers over the past year — can reliably predict future success in the NFL for Wide Receivers. This model, known as the Star-Predictor Score (SPS), Currently has Calvin Johnson, Amari Cooper, and Larry Fitzgerald ranking #1, #2, and #3 respectively, all time. Within this article, we uncover the correlation, importance, and ideal benchmarks within this metric. Here are all of our findings:
The Star-Predictor Score (SPS) was built as a prospect scouting tool aimed at maximizing investment potential while minimizing risks when drafting rookies in Fantasy Football. Developed using data since 2003, the SPS formula was then applied to every drafted or undrafted free agent (UDFA) since then. From that, and out of a total of 893 Wide Receivers, the following top 10 prevailed:
To assess the SPS, we analyzed the top 50 fantasy football performers since 2003 utilizing PPR (Point Per Reception) fantasy scores. The “bottom 10” term, which you will see throughout this article, refers to those Wide Receivers who finished 41st-50th place each season. The Star-Predictor Score (SPS) for Wide Receivers utilizes 24 distinct metrics from various sources to predict NFL performances. It is presented in a percentile grading system, therefore the top player ever – Calvin Johnson – will have a 100.0 SPS grade.
Why only the top 50? We have done this for every metric we’ve researched. We applied the same methodology to accurately compare this as a metric to every other metric we’ve ever looked at. Our selection of analyzing the top 50 players comes from a desire to establish a “happy medium.” Going further than the top 50 would include fringe roster players who are unlikely to finish top 10 and therefore would potentially just skew the data. On the other hand, we still wanted to compare the “best” to the “worst,” which would not be simply the top 10 to the next 10 (11th to 20th place). Therefore, we went down to the 41st through 50th place finishers each season since 2003 to establish this “best” to “worst” comparison.
Before we get into the research itself, it’s important to note where the SPS excels at. To sum it up; the SPS specializes in 1st and 2nd round Wide Receivers. All 1st or 2nd round WR’s will be published on our table. The higher their SPS, the more likely they are to have career success, measured by fantasy points. The players in the green signify a greater chance of career success than for those with high depth chart positions but not marked in green, which is where the performance likelihood drop-off occurs.
Take Malik Nabers and Marvin Harrison Jr. as examples. Although they were drafted in reverse order of their SPS rankings, their rookie season results matched their SPS perfectly in two ways; order and the relative gap between the players, as seen below:
This demonstrates how the SPS can inform your draft choices, particularly for players who have secure depth chart positions entering their rookie seasons, just like these two did. If you had a top rookie draft pick, you might have been more inclined to trade back to draft Malik, gaining an additional asset in the process, instead of maintaining your spot for Marvin Harrison Jr. In simple terms, the SPS revealed that there was actually no gap between MHJ and Malik, and even contradicted what most industry experts were telling us.
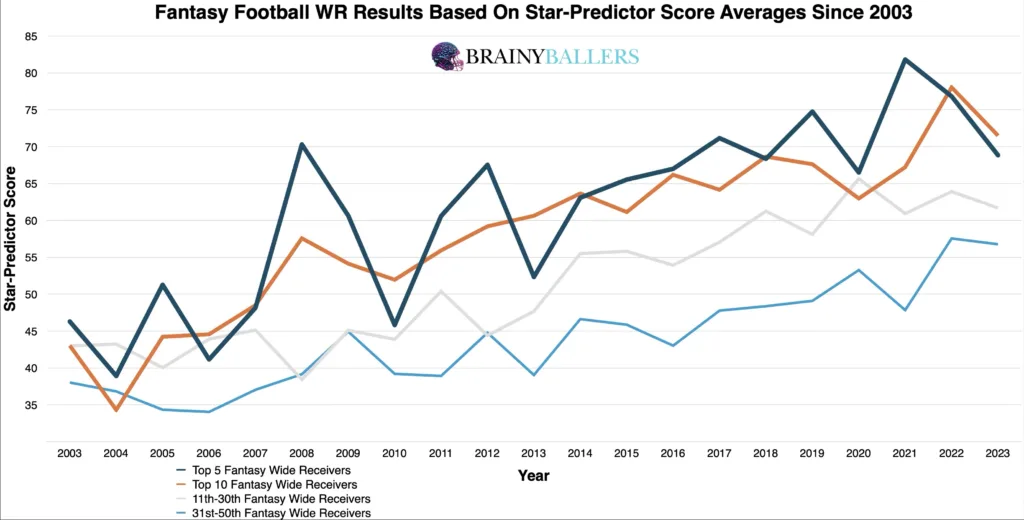
To begin our research, we created an averages chart for the top 5, top 10, 11-30th place, and 31st-50th place fantasy football finishers every year since 2003. From this, the correlation was extremely easy to spot. As you can see, the top 5 performers (dark blue line) consistently had higher SPS grades compared to those in the 31st-50th bracket (light blue line). This chart usually highlights correlation or no-correlation metrics, like in the example with defensive end weights where no trend was visible in the averages chart, and weights ended up having zero correlation and therefore shouldn’t be used in scouting. As for the SPS, the trend held firm over all 21 seasons, reinforcing the potential predictive power of the SPS.
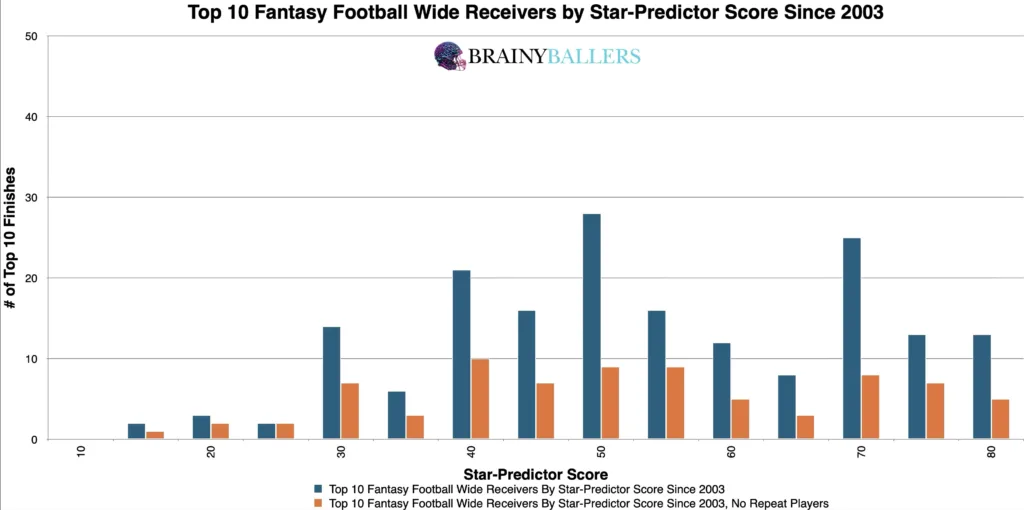
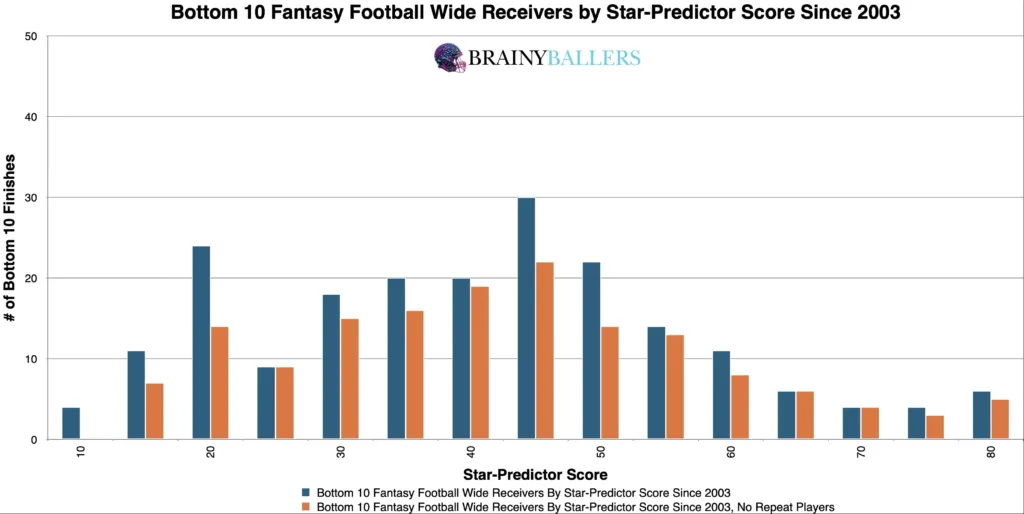
We next segmented the data out by analyzing top and bottom 10 finishers into 5.0 SPS increments. This analysis further showed that higher SPS scores were more likely associated with higher fantasy football outcomes than lower ones. The weight and distribution of both these charts is how that can be seen, where you can will the top 10 first:
A critical aspect of all our analysis has been identifying the optimal range that corresponds the best with higher chances of success. To do this, we create a differences chart, with compared each SPS grade, plus the next 10.0 SPS, while subtracting the bottom 10 from the top 10 within those groupings. The chart’s desired outcome is a negative number for unique differences (Orange) and a positive number for non-unique differences (Blue). This would indicate the top level consistency we are hoping for. From this, we found that 55 and above SPS appears to be a top producing threshold, getting us close to an optimal threshold which we will verify next.
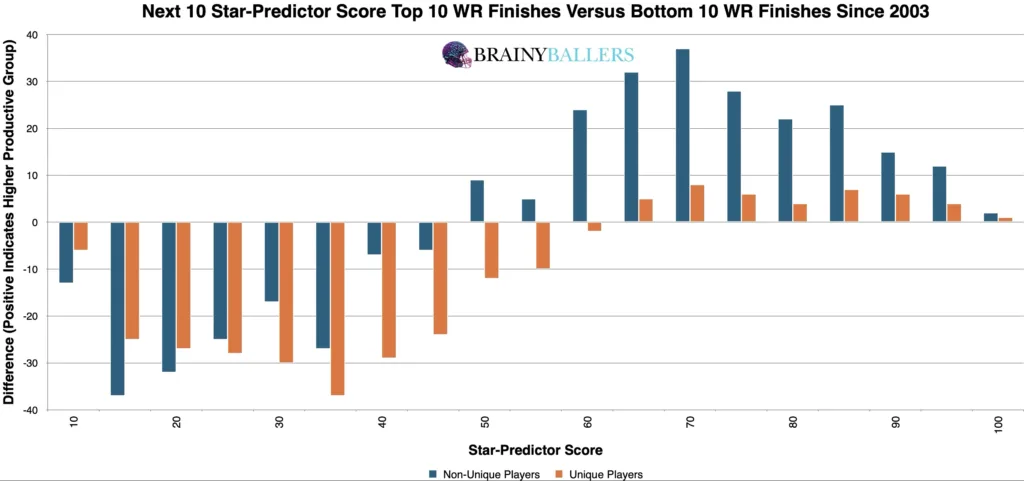
Our next step was to fine-tune our previously mentioned optimal range to find the most productive range. By testing all figures near the identified threshold, we found that adjusting the range to 60.0 and above resulted in a 35.2% higher top 10 appearance rate compared to the bottom 10. This refined range is now what is recommended for those tracking their favorite athletes, and will be the focus of this study going forward. The next question is now how much does this matter?
Our analysis next used standard statistical methods to find what the correlation is between Wide Receiver SPS grades and Fantasy scoring. Here is the Pearson value between SPS grades and fantasy scores:
This indicates strong correlation between a WR’s Star-Predictor score (SPS) and their future fantasy production. When studying world class athletes as we are, we are hoping for a Pearson of above 0.1 or below -0.1. The top correlation we found before this for WR’s was 0.266 (PFF’s Drop Rates), with draft capital itself showing a mere -0.142 — less than half the significance of our SPS.
In case anyone was curious what the correlation coefficient was when comparing draft capital and career fantasy points, then when comparing SPS grades to career fantasy points, here it is:
Positive and negative Pearson values are equally significant but in opposite directions. In this example, lower (higher value) overall draft capitals suggest a high probability of fantasy scoring, while higher SPS grades strongly indicate a higher fantasy score probability – and in a much more significant way than the lower draft capitals do.
Next, we compared data across decades to find whether the SPS is a growing or dying trend. In particular, we looked at the WR SPS optimal range amongst the top 10, 11th-40th, and bottom 10 fantasy finishers across the last two decades. This decadal differences chart indicated that the significance of this optimal range nearly doubled in the most recent decade when comparing the bottom 10 to the top 10 in both decades (blue), therefore meaning the SPS is a growing trend.
| 2004-2013 | |||
| Top 10 | 11 through 40 | Bottom 10 | |
| All count | 100 | 300 | 100 |
| All 52.6 and above | 39 | 84 | 13 |
| % (Optimal Range/all) | 39.0% | 28.0% | 13.0% |
| 2014-2023 | |||
| Top 10 | 11 through 40 | Bottom 10 | |
| All count | 100 | 300 | 100 |
| All 52.6 and above | 83 | 186 | 34 |
| % (Optimal Range/all) | 83.0% | 62.0% | 34.0% |
As far as the SPS table itself, users can filter and search data efficiently by applying parameters such as year, position, name, SPS scores, or colleges. The green cells in both SPS columns shows that the player is within the optimal range for future success chances. If you’re in green, you’re atop the bellcurve, with 100 being at the very top of the bell curve. The yellow indicates where the performance likelihood decline starts and transitions to red to indicate the players who are on the exponentially declining sides of the bellcurve. These tools and capabilities make it an invaluable asset for evaluating wide receiver performances and finding sleepers or comparing player analytical profiles and future outlooks.

The Star-Predictor Score (SPS) is a scouting tool designed to maximize investment potential and reduce risks when drafting rookies in Fantasy Football. It is proven to have a higher accuracy than draft capital alone to predict fantasy success. The SPS includes 13 to 17 metrics, with the exact number varying by the player’s position. All these metrics are pre-NFL, and some are invented by us, providing a complete analysis of a player’s analytical profiles. The SPS gained widespread notoriety for its high accuracy, having made it on Barstool and The Pat McAfee Show. The SPS can be found here.
What 3 metrics matter the most when scouting a rookie Quarterback? What threshold should Quarterbacks achieve within those metrics to be considered an elite prospect? How much should you value those stats above all other stats? Couldn't answer those questions? Rest easy, we have it handled for you. That's what this chart answers. Sort by importance and/or filter by position. Unlock by signing up with the links provided. $9.99/Year or $24.99 Lifetime access. Cancel anytime.
Our research on the WR Star-Predictor Score (SPS) model uncovered the strongest correlation we’ve seen for any metric, with a threshold that matches historical success patterns. A 52.6 or higher SPS grade is our benchmark for identifying top future WR talent and potential busts when evaluating players with a depth chart position that makes the player worthy of debating their future outlook.
Our series has always sought to push the boundaries of sports analytics. This latest installment reaffirms our commitment to uncovering the hidden dynamics that define the game. Every Saturday, we’ll dive into intriguing questions, bust myths, and settle debates with thorough analysis. We welcome your input. Therefore, please leave comments or reach out with topics you’re eager to see dissected. All of our research can be found on our Analytics Page. Up next on our agenda for Part 49 of “Does It Matter?” is an examination of Quarterback college TD/INT Ratio: Does it matter? If so, what’s the TD/INT threshold necessary for NFL success? Mark your calendars; every Saturday we shed light on the topics that matter to you. All it takes is a quick question being asked and we will go to work for you!


BrainyBallers Buy-Hold-Sell Chart (All Players)
Get Your Products 100% Refunded By Predicting The Next SuperBowl Winner!
For our extensive 68-part series, “Does It Matter?”, we have yet another interesting topic: can a Tight End’s college career Yards Per
For our latest 67-part “Does It Matter?” series entry, we looked into the topic of whether a Tight End’s Body Mass Index
In our extensive 65-part “Does It Matter?” series, we have explored various metrics to gauge their effectiveness in predicting an NFL player’s
